Why One Method Is Never Enough
Blood lactate threshold determination has been studied for decades. Researchers have proposed dozens of methods, yet the scientific literature consistently shows that no single method is universally superior. Studies comparing OBLA, D-max, IAT and log-log methods find they often disagree by 20–40 W on the same dataset.
This is not a bug — it is a feature of the biology. Lactate thresholds are not sharply defined events but gradual physiological transitions. Different methods capture different aspects of that transition. LaChart's approach is to run all major validated methods in parallel, understand what each is measuring, and produce a consensus result that is robust to single-method errors.
Step 1: Polynomial Regression — The Foundation
Before any threshold can be detected, LaChart fits a polynomial regression curve (degree 2–4, selected automatically by sample size) to your raw lactate data using ordinary least squares via LU decomposition:
// LaChart source (DataTable.jsx — simplified)
const degree = Math.min(4, n - 1);
// Build Vandermonde matrix X, solve X'X β = X'Y
const coeffs = math.lusolve(XTX, XTY).flat();
const polyFn  = (x) => coeffs.reduce((acc, c, d) => acc + c * Math.pow(x, d), 0);
const derivFn = (x) => coeffs.slice(1).reduce((acc, c, d) => acc + (d+1)*c*Math.pow(x,d), 0);
This smooth curve allows all downstream methods to interpolate threshold power/pace values at precise lactate concentrations rather than being constrained to discrete test steps. The first derivative derivFn is used directly by some methods to detect inflection points.
Step 2: Outlier Filtering and Monotonic Smoothing
Real-world lactate data contains noise: a slightly crushed finger, sweat contamination, or a missed stage recovery. LaChart applies two pre-processing steps:
- Outlier rejection: Any point where lactate drops more than 0.5 mmol/L relative to the previous point — without a corresponding large drop in intensity — is flagged and excluded from curve fitting. A single noisy sample can otherwise shift the polynomial by 20–30 W.
- Median-3 smoothing: Each interior point's lactate is replaced by the median of itself and its two neighbours. This removes isolated spikes while preserving genuine physiological breakpoints.
Method 1: OBLA (Onset of Blood Lactate Accumulation)
OBLA is the oldest widely-used method: find the exercise intensity where lactate concentration crosses a fixed threshold. LaChart calculates four variants simultaneously:
| Method | Fixed lactate (mmol/L) | Typical use |
|---|---|---|
| OBLA 2.0 | 2.0 | Aerobic threshold proxy (LT1) |
| OBLA 2.5 | 2.5 | Conservative aerobic threshold |
| OBLA 3.0 | 3.0 | Moderate intensity marker |
| OBLA 3.5 | 3.5 | Near-threshold marker |
The power at each OBLA level is interpolated from the polynomial curve using binary search across 400 equally-spaced points. This gives sub-watt precision regardless of step size.
Limitation: OBLA assumes that the physiologically meaningful threshold occurs at the same absolute lactate for all athletes. Research shows individual MLSS ranges from 1.5 to over 7 mmol/L. For this reason, LaChart uses OBLA values as cross-validation anchors, not as final outputs in isolation.
Method 2: D-max
The D-max method draws a straight line between the first and last data points of the lactate curve, then finds the measured point that lies farthest from this line — the point of maximum perpendicular distance.
// LaChart D-max (DataTable.jsx)
const slope = (lastPoint.lactate - firstPoint.lactate) /
              (lastPoint.power  - firstPoint.power);
const intercept = firstPoint.lactate - slope * firstPoint.power;

let maxDistance = 0;
for (const point of middlePoints) {
  const distance = Math.abs(point.lactate - (slope * point.power + intercept))
                   / Math.sqrt(1 + slope * slope);
  if (distance > maxDistance) { maxDistance = distance; dmaxPoint = point; }
}
This is mathematically the point of maximum curvature — where the lactate curve departs most strongly from a linear relationship. It is sport-agnostic and requires no fixed lactate assumptions. LaChart uses D-max as a primary LT2 candidate, especially when OBLA values seem atypically high or low.
Method 3: IAT (Individual Anaerobic Threshold)
IAT finds the step with the steepest lactate increase per unit of power:
// LaChart IAT (DataTable.jsx)
for (let i = 1; i < sortedPoints.length; i++) {
  const powerDiff = sortedPoints[i].power - sortedPoints[i-1].power;
  const increase  = (sortedPoints[i].lactate - sortedPoints[i-1].lactate) / powerDiff;
  if (increase > maxIncrease) { maxIncrease = increase; iatPoint = sortedPoints[i]; }
}
IAT is particularly useful for identifying the onset of rapid lactate accumulation — the "elbow" of the curve that many coaches intuitively locate by eye. It is sensitive to step size and requires at least 3 data points to be meaningful.
Method 4: Log-Log Transformation
When lactate and power are both transformed to logarithmic scale, the aerobic threshold (LT1) typically appears as a clear change in slope — the log-log breakpoint. LaChart detects this by scanning for the index with maximum slope change:
// LaChart Log-log (DataTable.jsx)
const logData = results.map(r => ({ logPower: Math.log(r.power), logLactate: Math.log(r.lactate) }));

for (let i = 1; i < logData.length - 1; i++) {
  const slopeBefore = (logData[i].logLactate - logData[i-1].logLactate) /
                      (logData[i].logPower   - logData[i-1].logPower);
  const slopeAfter  = (logData[i+1].logLactate - logData[i].logLactate) /
                      (logData[i+1].logPower   - logData[i].logPower);
  const deltaSlope  = slopeAfter - slopeBefore;
  if (deltaSlope > maxDeltaSlope) { maxDeltaSlope = deltaSlope; breakpointIndex = i; }
}
Log-log is most reliable for LT1 detection in well-trained athletes where resting lactate is low (<1.5 mmol/L) and the aerobic break is subtle. For novice athletes with higher baseline lactate, other methods tend to be more accurate.
Methods 5–6: Baseline + Fixed Delta
LaChart calculates the resting or warm-up baseline lactate from the lowest measured values, then finds the power at which lactate exceeds baseline by a fixed amount. This personalises the OBLA concept: instead of assuming everyone thresholds at 2.0 mmol/L, we use your individual baseline.
- Bsln + 0.5: First detectable aerobic stimulus. Often corresponds to Zone 1/2 boundary.
- Bsln + 1.0: Conservative LT1 estimate. Good for athletes with very low baseline (<1.0 mmol/L).
- Bsln + 1.5: More traditional LT1 location. Aligns well with ventilatory threshold in most athletes.
Methods 7–8: LTP1 and LTP2 (LaChart Primary Thresholds)
LTP1 and LTP2 are LaChart's synthesised primary outputs — not a single method, but a multi-step algorithm that:
- Detects false starts: Some athletes show an initial lactate spike at low intensity (a common lab artefact), followed by a return to baseline. LaChart's
isLtp1FalseStartRise()function identifies this pattern and skips to the next genuine rise. - Applies physiological bounds: LT1 must fall between 1.5–2.2 mmol/L for cycling (2.5 mmol/L for running/swimming). LT2 must remain below 4.2 mmol/L and always be at least 25 W above LT1 for cycling (22 sec/km for running).
- Cross-validates with OBLA blend: The final LT2 is anchored near the midpoint of the OBLA 3.5–4.0 range to prevent over-fitting to a single measurement.
- Sport-specific logic: Running/swimming use pace (seconds/km or per 100 m), requiring inverted sorting and different gap thresholds than cycling watts.
Key physiological guardrails in LaChart
How LaChart Combines All Methods
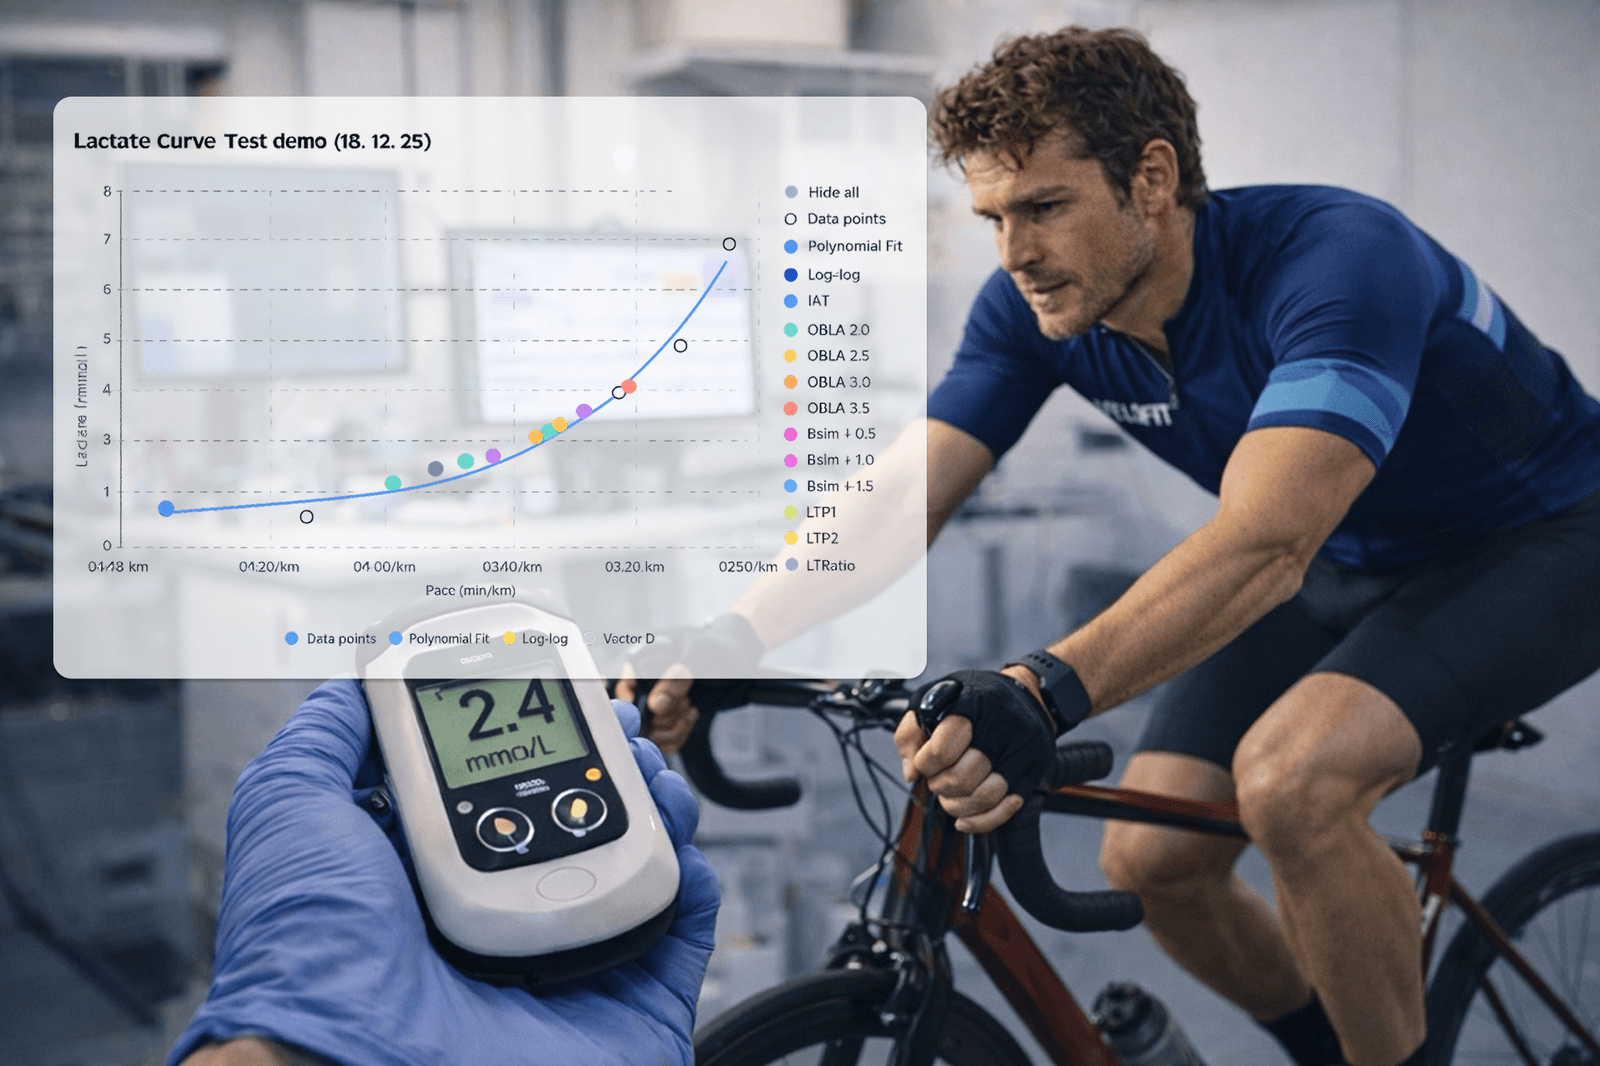
After running all 8 methods, LaChart displays each result as a separate marker on the lactate curve chart. The chart uses a distinct colour for each method so you can visually inspect agreement and disagreement.
The LTP1 and LTP2 values shown in the training zones table are the consensus outputs — validated against physiological bounds and cross-checked against the OBLA blend. When methods agree closely (within ±10 W), confidence is high. When they diverge, the chart helps you understand why (e.g. noisy data, atypical lactate profile).
Training Zones from LT1 and LT2
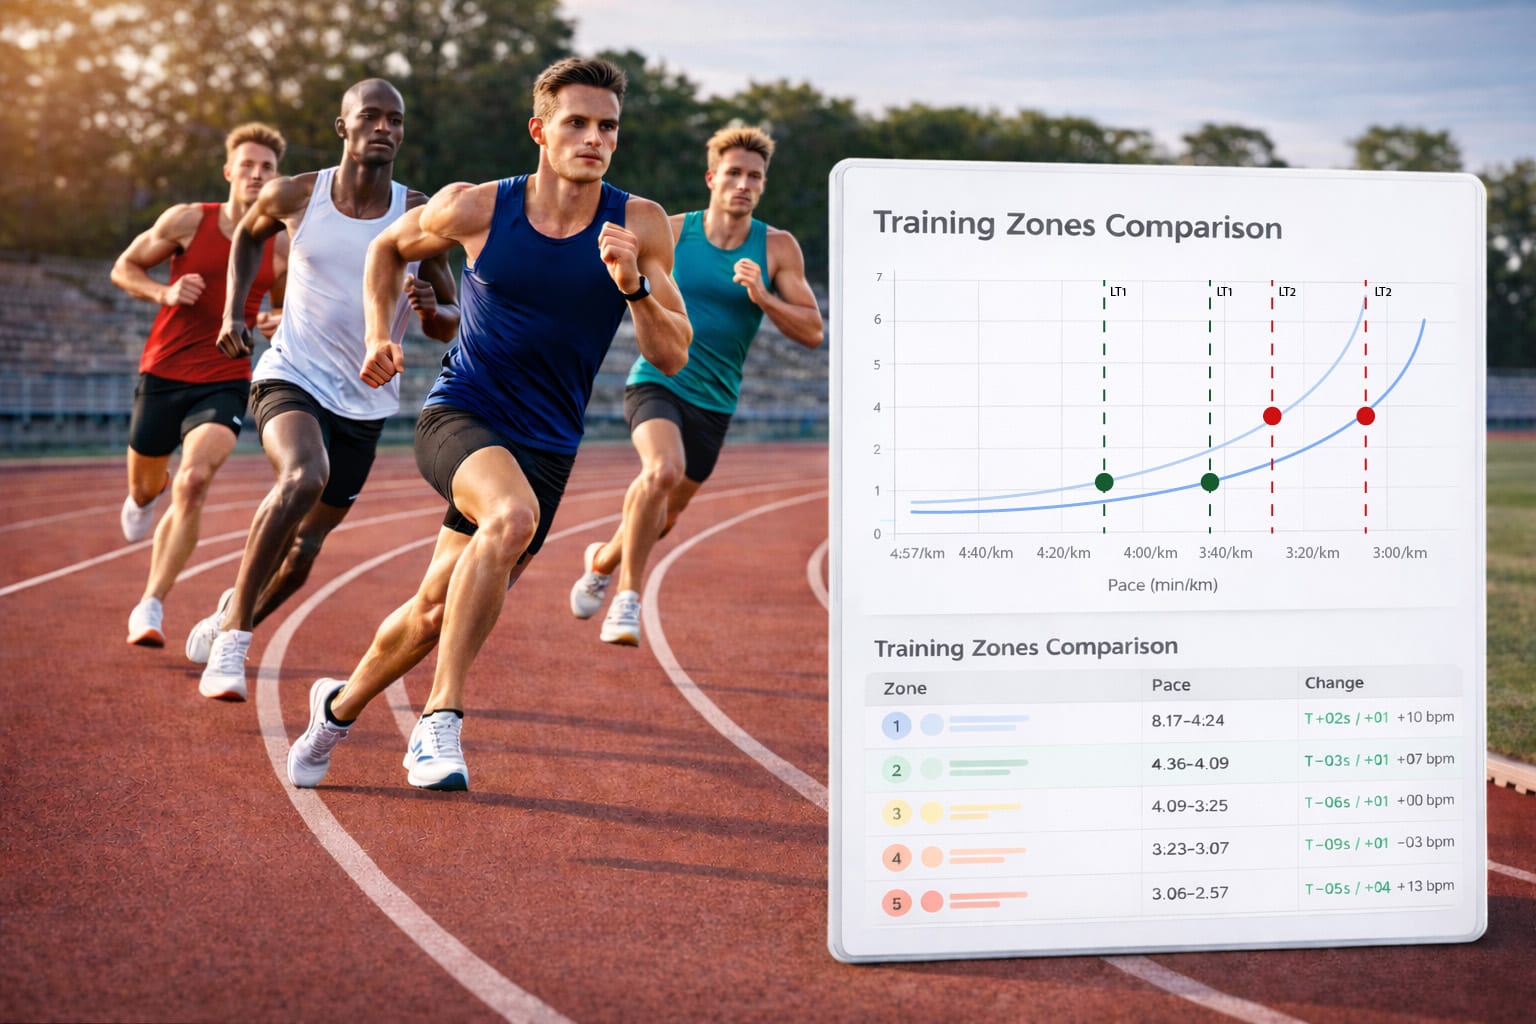
Once LTP1 and LTP2 are established, LaChart calculates 5 training zones using percentage offsets anchored to the two thresholds:
| Zone | Anchor | Typical lactate | Energy system |
|---|---|---|---|
| Z1 | Below LT1 | <1.5 mmol/L | Aerobic fat oxidation |
| Z2 | Up to LT1 | 1.5–2.2 mmol/L | Aerobic (Zone 2 / base) |
| Z3 | LT1–LT2 midpoint | 2.2–3.0 mmol/L | Aerobic + lactate production |
| Z4 | Up to LT2 | 3.0–4.0 mmol/L | Lactate threshold |
| Z5 | Above LT2 | >4.0 mmol/L | Anaerobic / VO₂max |