Key Takeaway
No single method is universally superior. Research shows that OBLA, D-max, IAT, and log-log methods identify different exercise intensities on the same data — often diverging by 20–50 W in cyclists. The most accurate approach combines all methods and validates against physiological constraints. This is exactly what LaChart does.
Why We Need Multiple Methods
A review of the lactate threshold literature summarises the core problem clearly: individual variation in lactate concentration at the "true" threshold ranges from as low as 1.4 mmol/L to as high as 7.5 mmol/L. Any method that picks a fixed blood lactate value will be right for some athletes and wrong for many others.
This creates a fundamental tension: simple methods (like OBLA with fixed values) are easy to apply but physiologically crude. Sophisticated methods (like polynomial D-max or segmented regression) are more physiologically grounded but require more data points and can fail with noisy inputs.
The solution is not to pick one method and defend it — it is to run all validated methods in parallel, understand what each is measuring, and make a consensus decision. This is how sports science laboratories approach threshold determination, and it is the approach LaChart automates for every test.
Method 1: OBLA (Onset of Blood Lactate Accumulation)
Cross-athlete comparisons in research; quick field estimates when detailed curve fitting isn't possible.
Individual prescription; highly trained or very sedentary athletes whose threshold lactate diverges far from population averages.
4 OBLA variants (2.0, 2.5, 3.0, 3.5 mmol/L) as cross-validation anchors for the primary LT1/LT2 result.
How it works: OBLA identifies the exercise intensity (power or pace) at which blood lactate concentration crosses a predetermined fixed value. The most common is 4 mmol/L, first popularised by Mader et al. in the 1970s. Subsequent research proposed 2 mmol/L as an aerobic threshold marker, with various values in between used by different laboratories.
The science: The popularity of OBLA 4 mmol/L stems from observations that trained athletes could sustain effort at approximately this concentration for extended periods — matching MLSS (Maximal Lactate Steady State). However, MLSS itself varies enormously: published ranges show MLSS between 1.5–7.0 mmol/L across individuals, averaging around 3.7 mmol/L.
The problem in practice: For an elite cyclist whose MLSS is 5.5 mmol/L, OBLA 4.0 significantly underestimates their threshold — leading to training zones that are too conservative. For a recreational runner with MLSS at 2.8 mmol/L, OBLA 4.0 overestimates threshold, potentially causing chronic overtraining.
| OBLA Variant | Lactate target | Intended threshold | Reliability |
|---|---|---|---|
| OBLA 2.0 | 2.0 mmol/L | Aerobic (LT1) | Good for untrained; overestimates LT1 in highly trained |
| OBLA 2.5 | 2.5 mmol/L | Conservative LT1 | Reasonable compromise; standard in some labs |
| OBLA 3.5 | 3.5 mmol/L | Near-threshold | Aligns with MLSS for average athletes |
| OBLA 4.0 | 4.0 mmol/L | Anaerobic (LT2) | Population average MLSS — highly variable individually |
Method 2: D-max (Maximum Distance Method)
Athletes with atypical lactate profiles; identifying LT2 on well-formed exponential curves.
Tests with fewer than 5 data points; noisy data with outliers; athletes with unusual lactate kinetics (e.g. early plateau).
As a primary LT2 candidate, after outlier filtering and monotonic smoothing of the input data.
How it works: D-max draws a straight line between the first and last points of the lactate curve. It then calculates the perpendicular distance from each measured point to this line. The point of maximum distance — D-max — is taken as the threshold.
Geometrically, this is the point of maximum curvature — where the lactate curve most strongly departs from a linear relationship between intensity and blood lactate. It requires no fixed lactate value assumption and is therefore individualised.
Research findings: D-max correlates well with visual LT identification by trained physiologists and with ventilatory threshold. It tends to produce higher threshold estimates than OBLA 4.0, especially in trained athletes. The downside is sensitivity to outliers: a single aberrant data point can shift the baseline line and move the D-max point significantly.
Variants: The Modified D-max method (Dmax-mod) fits a third-order polynomial to the curve first, then applies the maximum-distance algorithm to the smooth curve rather than raw points. LaChart's implementation combines polynomial fitting with D-max calculation for improved robustness.
Method 3: IAT (Individual Anaerobic Threshold)
Identifying the onset of rapid accumulation; confirming LT2 location when the curve has a clear "elbow."
Very gradual curves without a clear inflection; tests with unequal step sizes (results are sensitive to increment width).
To confirm the LT2 location and identify the steepest segment of the curve for running/swimming sports.
How it works: IAT identifies the exercise step with the largest lactate increase relative to the change in intensity (Δlactate / Δpower). This is the point where lactate most rapidly begins accumulating — the "knee" of the curve that coaches often identify intuitively.
The concept: IAT was proposed to account for the fact that threshold is not a fixed lactate concentration but a kinetic event — the transition point where the rate of lactate production begins outpacing clearance. By measuring the slope of lactate change, it captures this dynamic more directly than a fixed-value method.
Limitation: IAT is sensitive to step duration and increment size. With larger steps (e.g. 50 W increments vs 20 W), the method tends to identify higher threshold powers. Standardised step size is therefore important for reproducible IAT values across test sessions.
Method 4: Log-Log Transformation
LT1 (aerobic threshold) detection in trained athletes with low resting lactate; subtle threshold curves.
Athletes with resting lactate above 1.5 mmol/L; tests with fewer than 5 points; very non-monotonic data.
As an LT1 detection method and as a fallback when LT1 and LT2 are squeezed too close together.
How it works: When both blood lactate and exercise intensity are plotted on a log-log scale (log lactate vs log power), the aerobic threshold typically appears as a clear breakpoint — a change in slope from shallow to steep. This linearises the exponential portion of the lactate curve, making the inflection point visually and mathematically easier to detect.
slopeBefore = Δlog(lactate) / Δlog(power)  // between points i-1 and i
slopeAfter  = Δlog(lactate) / Δlog(power)  // between points i and i+1
breakpoint  = argmax(slopeAfter - slopeBefore)
Why it works for LT1: In a well-trained athlete with resting lactate near 0.8–1.0 mmol/L, the aerobic threshold is subtle — lactate rises gradually. In linear space, this can be hard to detect. The log transformation amplifies small changes at low lactate values relative to large changes at high values, making LT1 stand out more clearly.
Head-to-Head Comparison
| Criterion | OBLA | D-max | IAT | Log-log |
|---|---|---|---|---|
| Individualised | ✗ | ✓ | ✓ | ✓ |
| Reproducible | ✓✓ | ✓ | ✓ | ✓ |
| Noise resistant | ✓✓ | ✗ | ✓ | ✓ |
| Good for LT1 | 2.0/2.5 only | ✗ | ✗ | ✓✓ |
| Good for LT2 | 3.5/4.0 only | ✓✓ | ✓✓ | ✗ |
| Min data points | 4 | 5 | 4 | 5 |
| Handles outliers | ✗ | ✗ | ✓ partial | ✓ |
The LaChart Approach: Consensus Over Competition
LaChart runs all four methods (plus baseline-delta variants and the primary LTP algorithm) on every test. Rather than declaring one method "correct," it:
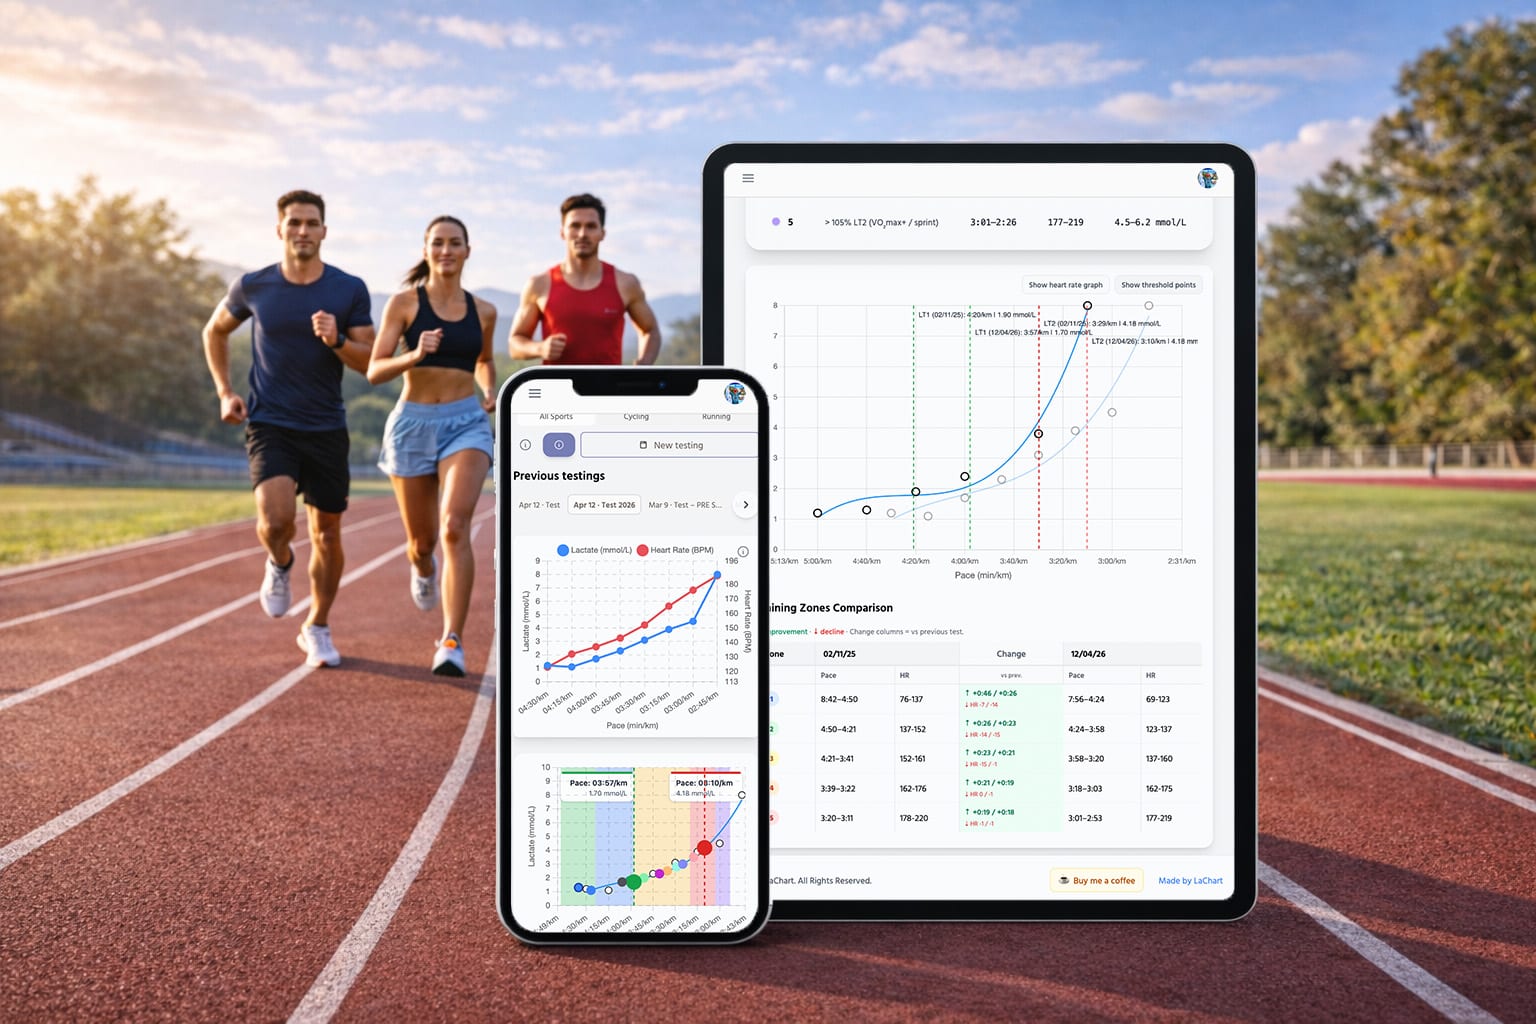
- Displays all method results as visible markers on the lactate curve
- Uses physiological guardrails to reject anatomically implausible values
- Produces LTP1 (LT1) and LTP2 (LT2) as validated consensus values
- Highlights disagreement when methods diverge significantly — alerting you to potentially noisy data
When all methods agree (within ±15 W for cycling, ±5 sec/km for running), confidence in the threshold is high. When they diverge, it usually indicates either (a) genuinely atypical lactate kinetics requiring expert interpretation, or (b) data quality issues in the test.
This transparent, multi-method approach is what separates lactate analysis from guesswork.