Quick Protocol Reference
Why Protocol Standardisation Matters
Blood lactate concentration is not a fixed physiological property — it is dynamic, context-dependent, and exquisitely sensitive to the conditions of measurement. Two tests on the same athlete, run one week apart with slightly different warm-ups, can produce LT2 values that differ by 30–40 W. This is not measurement error; it is real physiological variation caused by protocol inconsistency.
Standardisation serves two purposes: (1) making the test result meaningful in absolute terms, and (2) making it comparable across time — so you can actually track training adaptations.
48–72 Hours Before the Test
Hard sessions cause residual lactate elevation for 24–36 hours. A Zone 4 workout the day before will artificially depress your apparent threshold.
Alcohol alters hepatic lactate clearance and elevates resting lactate for up to 24 hours.
Low-carb states shift the lactate curve leftward — you appear to threshold at lower power, misleading your zone calculation.
Sleep deprivation elevates baseline lactate by 0.3–0.6 mmol/L on average.
If you always test at 9 am, always test at 9 am. Diurnal variation affects lactate by up to 15%.
Equipment Checklist
Lactate analyser
Lactate Plus, Lactate Scout, or lab-grade analyser. Calibrate before each session.
Test strips
Use strips from the same batch throughout a test series. Batch variation can cause systematic error.
Lancets
Use a fatter-gauge lancet for a larger drop. Thin, watery blood indicates sweat contamination.
Alcohol wipes
Wipe, then let the finger dry completely before lancing. Wet alcohol dilutes the sample.
Power meter / GPS
For cycling, a calibrated power meter is non-negotiable. Heart rate alone cannot define stages reliably.
Timer
Stage end must be precise. Late sampling (>30 sec after step end) allows lactate to clear, lowering values.
Step 1: Warm-Up (15–20 Minutes)
The warm-up serves two physiological purposes: elevating core temperature to ensure enzyme kinetics are stable, and flushing resting lactate toward a physiological baseline (not zero — the body always produces some lactate at rest).
Target effort: RPE 2–3 (easy conversation pace). Heart rate should not exceed approximately 65% of max HR. For cyclists, 100–130 W is typical for well-trained athletes; for runners, about 60% of 10 K race pace.
Take an optional resting sample before warm-up if you want to document baseline. Normal resting lactate is 0.8–1.2 mmol/L. Values above 1.5 mmol/L at rest suggest incomplete recovery from previous training.
Step 2: Running the Incremental Test
Set your starting intensity
Begin well below your expected LT1. For cyclists: approximately 40–50% of FTP (or known LT2). For runners: about 2–3 min/km slower than threshold pace. You want your first 2–3 stages to be fully aerobic with lactate in the 1.0–1.8 mmol/L range.
Hold each step for exactly 4 minutes
Four minutes is the standard — long enough for lactate to stabilise at steady state, short enough to complete the full curve before fatigue compromises later steps. Some laboratories use 3-minute steps for very high-intensity testing; 5-minute steps may be needed for sedentary populations.
Take blood at the last 30 seconds of each step
Sample timing is critical. Lactate is highest at the end of a step and begins clearing as soon as intensity drops. Sample from the fingertip. Lance, wipe away the first drop (contains interstitial fluid), then collect the second drop directly onto the strip.
Increase by consistent increments
Cycling: 20–30 W per step. Running: 0.5 km/h or 10 sec/km per step. Swimming: 25 m per 100 m split. Consistent increments are important for D-max and polynomial fitting — irregular steps introduce fitting errors.
Continue until lactate clearly exceeds LT2
You need at least 2–3 data points above LT2 for the algorithm to accurately locate the threshold. Stop when lactate exceeds 7–8 mmol/L or the athlete reaches volitional exhaustion. Aim for 8–12 total steps.
Common Errors and How to Avoid Them
Sweat contamination or over-hydration
Wipe finger dry completely. Use alcohol wipe then wait 15 seconds. Take second drop, not first.
Inconsistent sampling timing or strip batch variation
Always sample at the same point in each step. Use strips from one batch. LaChart's outlier filter will catch isolated spikes.
Starting intensity too high or incomplete warm-up
Lower starting power. You need sub-threshold data for accurate curve fitting.
Step increments too small, or test too short
Increase step size. Extend test until you reach 5+ mmol/L or exhaustion.
HR monitor not worn or not recorded
Always record HR. LaChart uses it to interpolate HR at thresholds and generate HR-based training zones.
Step 3: Enter Data into LaChart
After the test, open LaChart's testing page and enter each step as a row in the data table:
| Field | What to enter | Notes |
|---|---|---|
| Power (W) / Pace | Average for the step | Use lap average, not last-second value |
| Lactate (mmol/L) | Analyser reading | Enter to 1 decimal (e.g. 1.8) |
| Heart Rate (bpm) | Average for last 60 sec of step | Or use step average |
| Duration (min) | 4 (or your step length) | Must be consistent across steps |
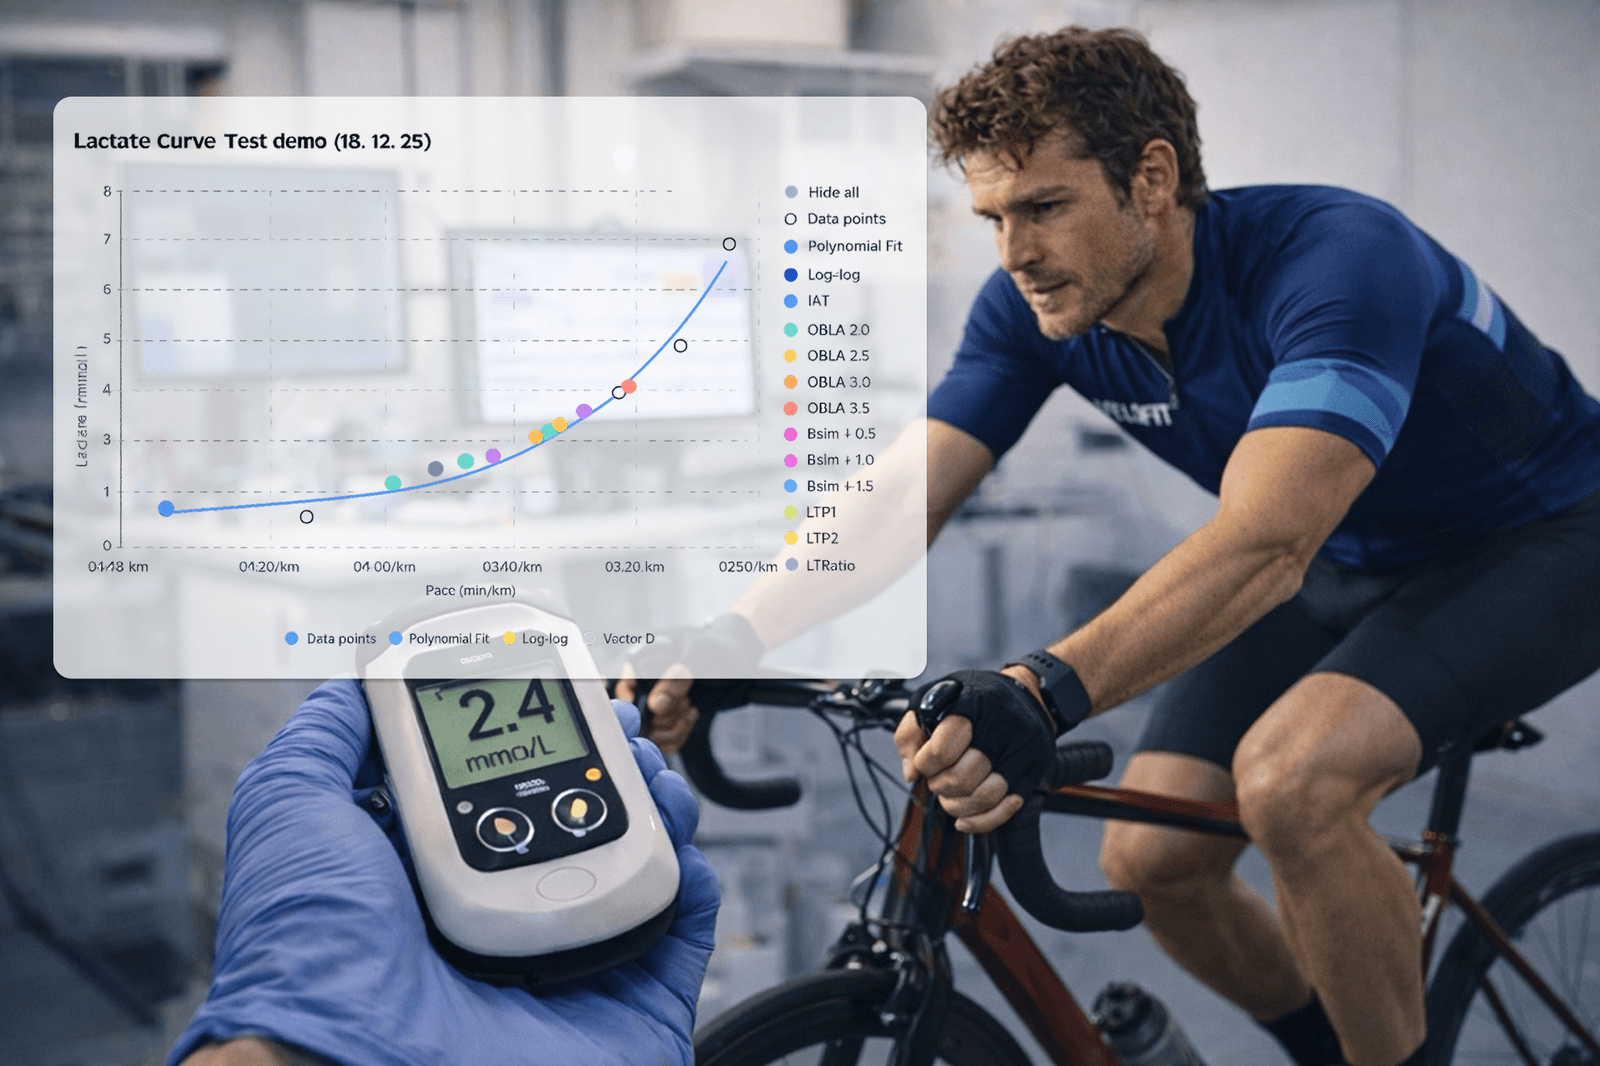
LaChart will immediately calculate the lactate curve, display LT1 and LT2 markers from all 8 methods, and generate your training zones. You can also download a professional PDF report to share with your coach.