Open any cycling forum, training app, or coaching book and you'll see FTP, LT2, MLSS, CP, and "threshold" used almost interchangeably. They aren't the same number, but for most well-trained athletes they're within ±10 W of each other — close enough that training prescriptions don't really care which one you used. Mostof the time.
This article walks through what each number actually measures, when they diverge, and which one you should use as the anchor of your training zones.
Definitions, briefly
FTP — Functional Threshold Power
Coined by Andrew Coggan around 2003. The highest average power you can sustain for ~60 minutes. In practice nobody actually does a 60-minute all-out time-trial test — too painful, too easy to pace badly, recovery cost is huge. Instead FTP is estimatedfrom a 20-min all-out test, multiplied by 0.95.
- Test: 20-min all-out time trial → FTP = avg × 0.95.
- What it actually measures: a power output that correlates well with 60-min sustainable power for most riders. It's a model output, not a physiological quantity.
- Where it goes wrong: riders with high anaerobic capacity (puncheurs, sprinters) over-shoot their 20-min test and the 0.95 multiplier under-estimates real sustainable power. Riders with low anaerobic capacity (pure diesels, ultra-endurance) can actually sustain > 95 % of their 20-min for an hour.
LT2 — Lactate Threshold 2 (anaerobic threshold)
A physiological measurement. The intensity at which blood lactate production permanently exceeds clearance and the curve becomes nearly vertical.
- Test: stepped blood-lactate test (the protocol from our home lactate test guide) → identify the deflection algorithmically (D-max, log-log, IAT, OBLA 4.0, etc.).
- What it actually measures: a real, repeatable physiological event — the point where anaerobic energy production is overwhelming the body's lactate-clearance machinery.
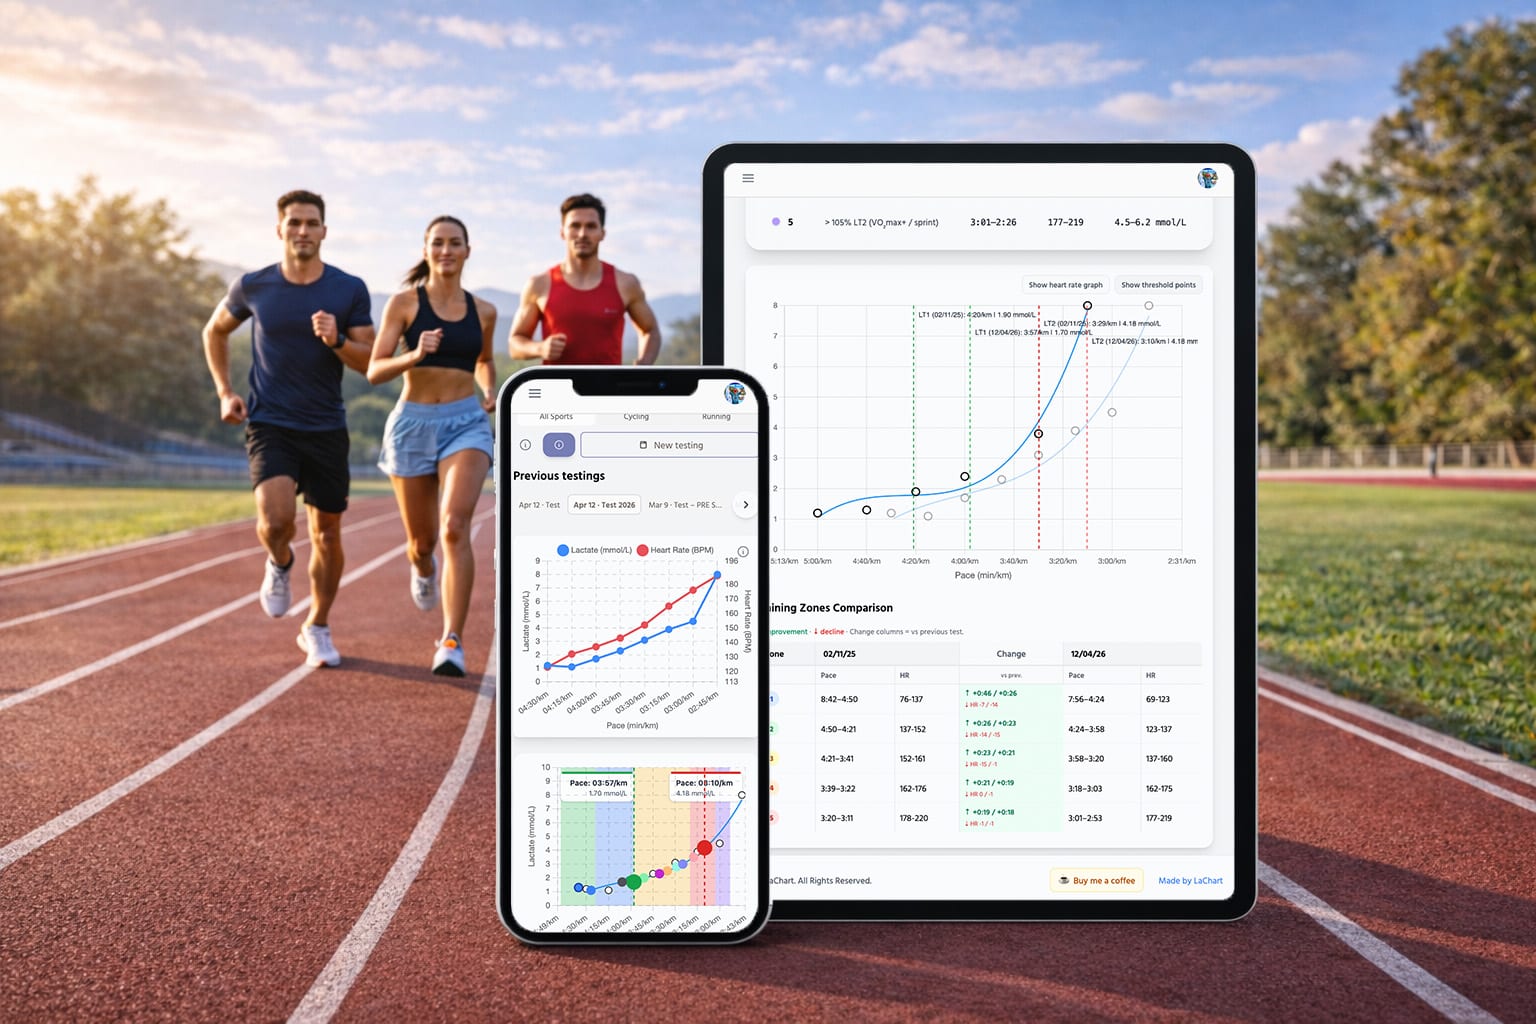
- Where it goes wrong: blood lactate has ±0.2 mmol/L sensor noise, the polynomial fit can be pulled off by one bad sample, and different detection methods can disagree by 10–30 W. The newer LaChart ensemble averages them to reduce this noise.
MLSS — Maximum Lactate Steady State
The single most physiologically "true" threshold. The highest intensity at which blood lactate concentration stays stable for ~30 minutes. Painful and time-consuming to test directly — needs multiple 30-min constant-power trials at different intensities, sampling lactate every 5 min, plotting which power level just barely flattens vs which one just barely climbs.
- Test: 4+ separate 30-min trials. Often used as the validation reference in sport-science papers; rarely run in practice.
- Relationship to LT2: typically within 5 W. LT2 from a step test slightly over-shoots MLSS in most studies.
CP — Critical Power
Mathematical model based on the relationship between power and time-to-exhaustion. The asymptote of the power-duration curve. Computed from 3 maximal efforts at different durations (typically 3 min, 12 min, 30 min — or shorter for sprinters).
- Test: 2–3 separate maximal efforts on different days, software fits the hyperbola.
- Relationship to FTP/LT2: CP is typically 3–5 % below FTP and is closer to MLSS than FTP is. Better-suited to riders with high anaerobic capacity.
How close do they actually sit?
For a typical, well-trained amateur cyclist:
| Metric | Sample value | % of LT2 |
|---|---|---|
| LT2 (lactate) | 280 W | 100 % |
| MLSS | 275 W | 98 % |
| FTP | 278 W | 99 % |
| Critical Power | 272 W | 97 % |
| VO2max power | 335 W | 120 % |
So for the average rider, FTP, LT2, MLSS, and CP all live in a 10 W band — about ±2 %. Training zones built from any of them will look essentially identical. If you set a Zone 4 interval at 95–105 % of FTP vs 95–105 % of LT2, the difference is one or two watts.
When they diverge — and which one to trust
Case 1: high anaerobic capacity (puncheur / sprinter)
A rider with a big anaerobic engine over-shoots the 20-min test by pulling on glycolytic reserves. Their FTP comes out 5–10 % above LT2. If they train against the inflated FTP, they're actually doing Zone 4+ intervals — over-cooked, lots of fatigue, lots of grey-zone injury risk.
Trust LT2. The physiology doesn't lie. Their 20-min number is just "what they can hold for 20 min", not what they can sustain.
Case 2: pure diesel / ultra-endurance rider
Low anaerobic capacity, huge aerobic base. Their 20-min test under-estimates sustainable power because they can't generate enough anaerobic contribution to push above LT2 for 20 minutes straight. FTP comes out 5–10 % below LT2. Training against the conservative FTP means leaving fitness on the table.
Trust LT2. Or run a 60-min Hour Record-style TT and use the true 60-min average. FTP estimation overcomplicates it for this type.
Case 3: badly executed lactate test
Sometimes a lactate test produces nonsense — bad sampling technique, protocol too aggressive, test stopped too early. If LT2 comes out at 150 W on a rider who can clearly hold 270 W for an hour, the test is wrong, not the rider.
Re-test. Or use FTP as the anchor until you can do the lactate test properly. See our protocol guide for how to avoid the four most common errors.
Case 4: detrained or recovering
After a layoff or illness, FTP estimates from old 20-min tests are meaningless. The lactate curve is the only thing that reflects current physiology accurately. Re-test and let the new LT2 set zones.
Which one should YOU train against?
For most cyclists, the answer is: whichever you have an accurate, current measurement of. They're close enough that training prescriptions won't differ in any meaningful way.
That said:
- LT2 wins on accuracy. It's a physiological measure, not a model output. Doesn't depend on pacing strategy or how rested you are on test day.
- FTP wins on convenience. No analyzer, no finger pricks, no protocol design — just a 20-min effort on any smart trainer.
- LT2 + LT1 together win on training design. FTP gives you one number; a lactate test gives you two thresholds plus the whole curve shape. That extra context tells you whether to spend the next block on Zone 2 (raise LT1) or threshold work (raise LT2).
The practical answer
Do both, six weeks apart. Run a 20-min FTP test to see if your numbers ballpark. Then run a proper lactate test to see the full curve and pin down LT1 and LT2. If the two numbers agree (within 5 %), use them interchangeably and re-test every 8 weeks. If they disagree by > 10 %, the lactate curve will tell you why — either your 20-min pacing was off or your anaerobic capacity is unusual.
Either way, the lactate test is the better anchor for long-term training because it doesn't care about test-day rested-ness or pacing psychology. It just measures what your muscles are doing.
The short answer
For most well-trained cyclists, FTP ≈ LT2 within 2–3 %.Train against whichever you have, and re-measure every 6–8 weeks. If they ever diverge by more than 5 %, your physiology is telling you something — usually that your aerobic / anaerobic capacity is unbalanced and your training mix should shift accordingly.
Want to compare yours?
Run a lactate test (we have a home protocol guide), drop the numbers into the free LaChart calculator, and compare the resulting LT2 to your latest FTP. 30 seconds, no signup.
Try free calculator →