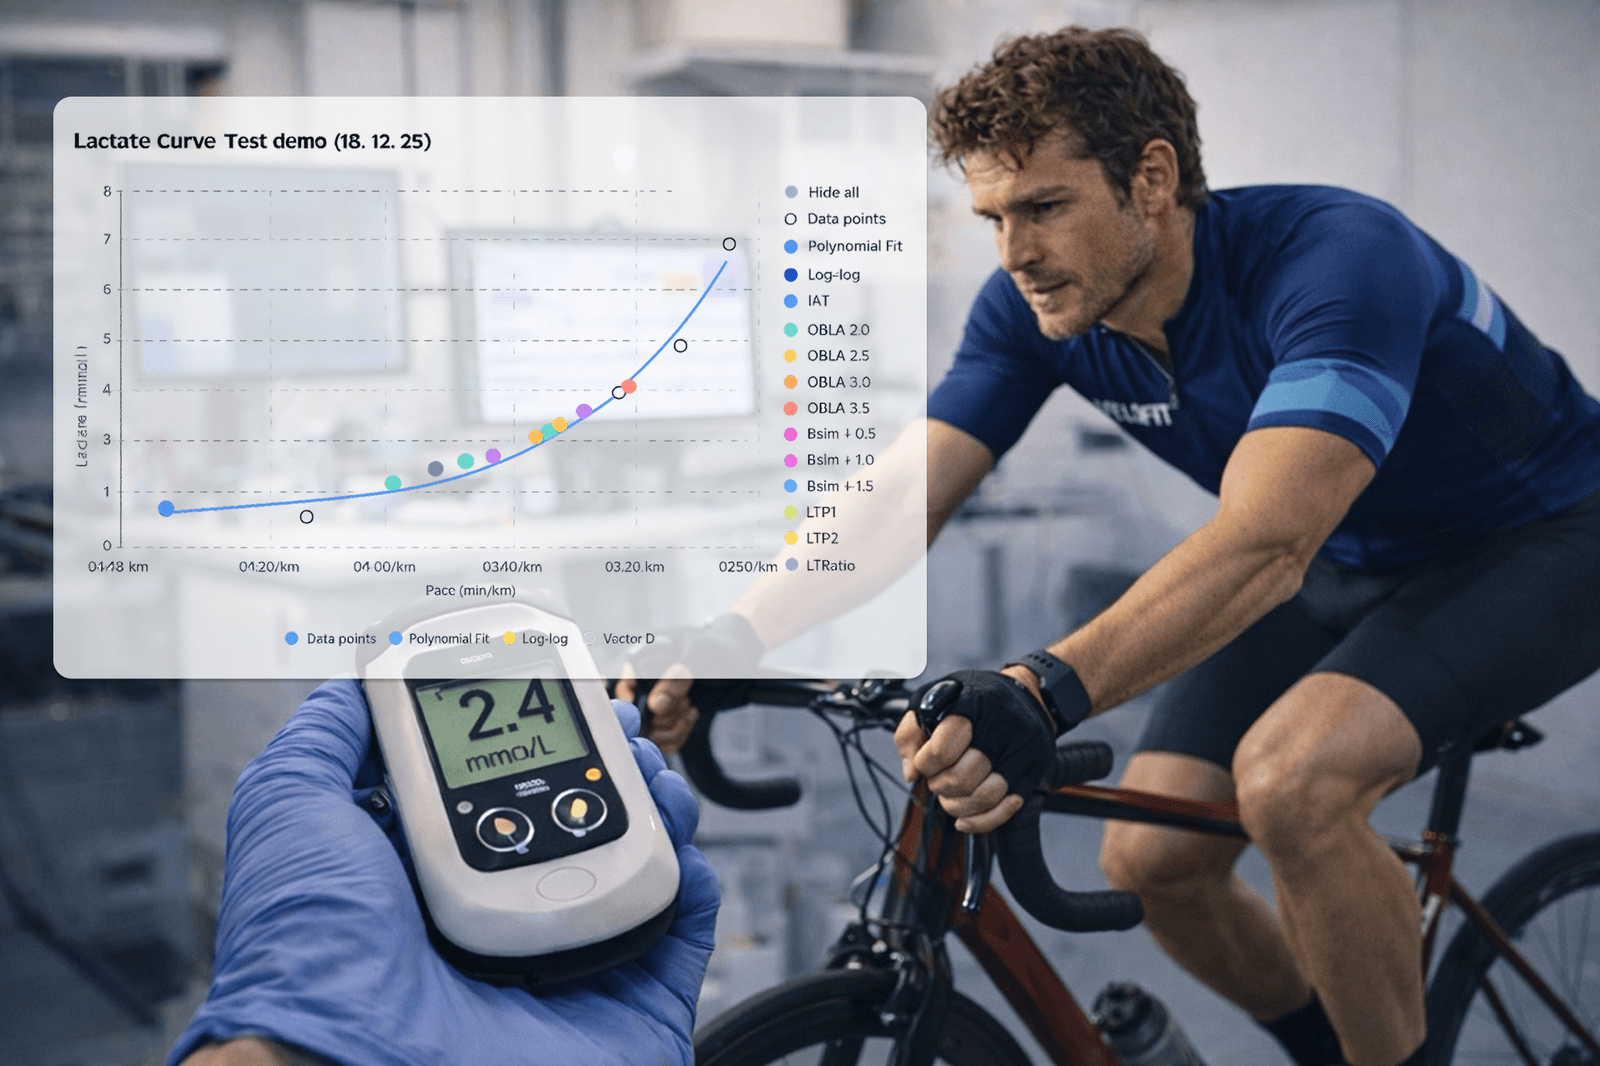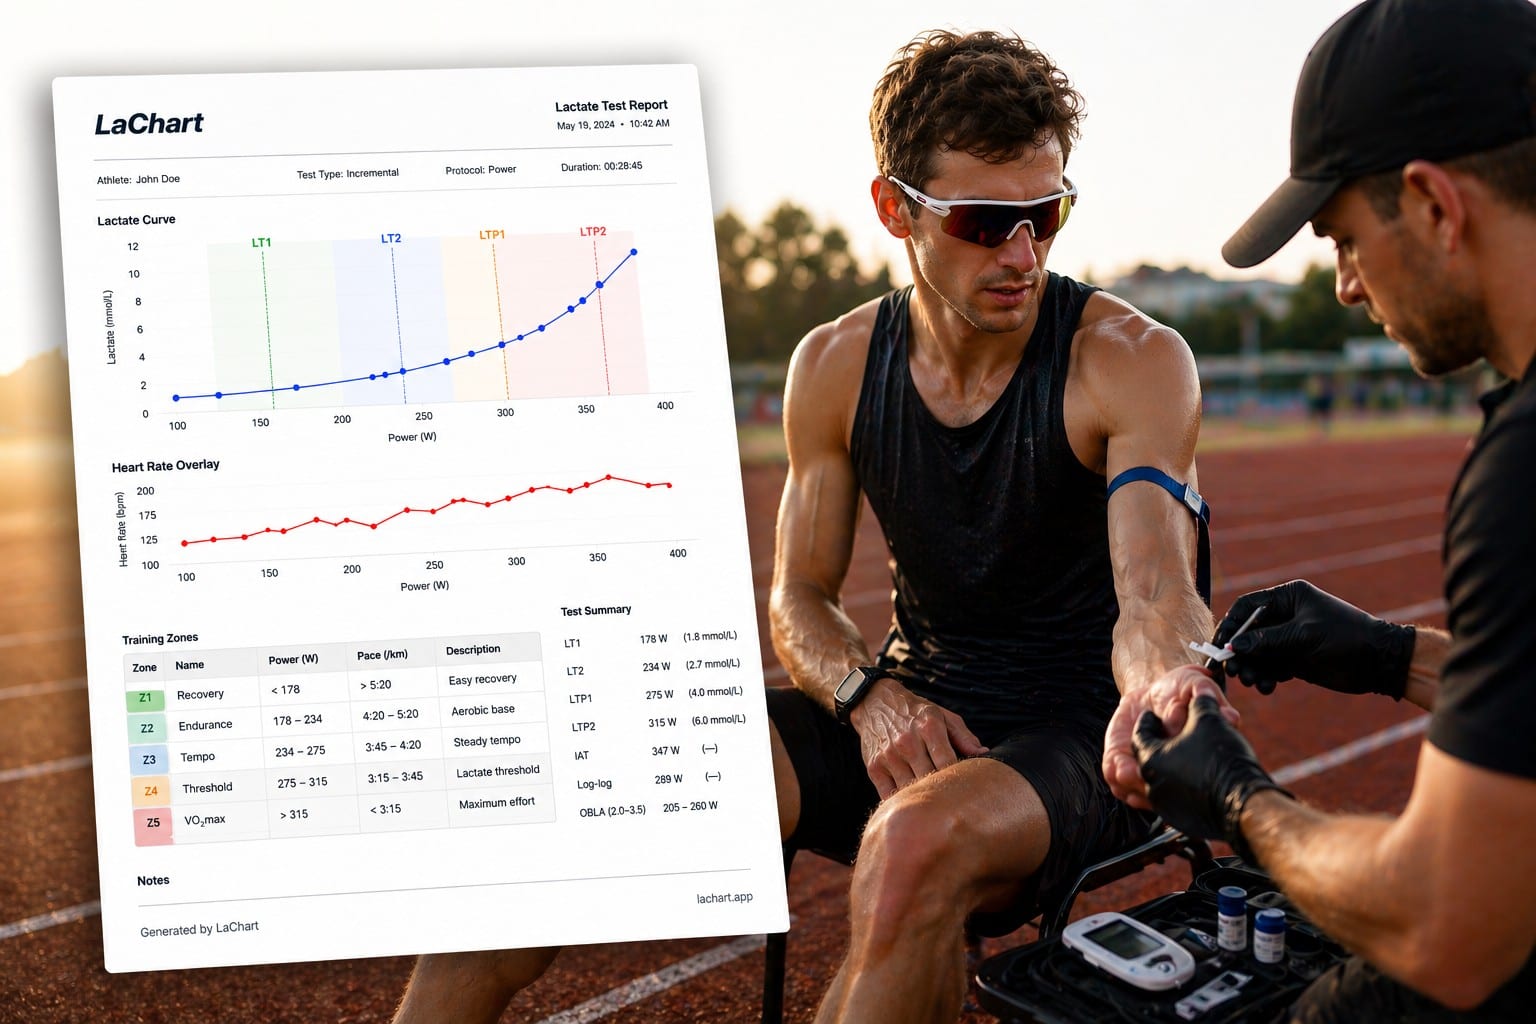
Most endurance coaches who test lactate do the hard part brilliantly — a clean step protocol, careful sampling, a good analyzer — and then hand the results over in a spreadsheet or a screenshot. The test is professional; the deliverable isn't. And the moment you're testing more than one or two clients, the spreadsheet quietly becomes the bottleneck: no history, no branding, no link to training.
This guide walks through what lactate testing software should actually do for a coach or a testing studio, so you can tell a real tool from a glorified calculator.
Why the spreadsheet stops scaling
A spreadsheet is fine for your own single test. As a coaching service it breaks down fast:
- No brand. A client paying for a lab-style test expects a report that looks the part — your logo, your studio name — not a grid of cells with a hand-drawn trendline.
- No history. The whole value of testing is seeing LT1 and LT2 move over a season. Comparing curves across dates in a spreadsheet is painful, so most coaches simply don't.
- Manual threshold maths. Eyeballing the deflection point, or applying a single fixed-lactate rule, is inconsistent between tests and between athletes.
- Disconnected from training. The zones you just calculated live in one file; the athlete's actual training lives somewhere else entirely.
What lactate testing software should do
1. Detect LT1 and LT2 properly — not with one formula
Threshold detection is the core of the job, and no single method is right for every athlete or every curve. Good software runs several — segmented regression, D-max, OBLA, IAT, log-log — and reconciles them into a consistent result, instead of trusting one rule that happens to misfire on a flat or noisy curve. If you want the background on the methods themselves, see our comparison of OBLA, D-max, IAT and log-log.
2. Produce a branded report you can hand over
This is the feature that turns testing into a service. The output should be a clean PDF — the lactate curve, LT1/LT2, and the athlete's power, heart-rate and pace zones — carrying your logo, studio name and contact details. That report is what the client remembers you by, and what they forward to training partners.
3. Keep every test, per athlete, forever
A coach's roster is a set of longitudinal stories. The software should store every test against each athlete, let you overlay curves over time, and show at a glance who is due for a re-test. That history is also your retention hook — clients come back to see the trend.
4. Connect testing to training
The zones you derive are only useful if the athlete trains by them. The best setup lets you push structured workouts into each athlete's calendar, then analyse what they actually did — laps, intervals, heart-rate and power curves, training load — against the zones the test produced. Testing and coaching stop being two separate tools. (For the athlete-side view of how thresholds become zones, see LT1 vs LT2 training zones.)
5. Manage a roster, not one athlete
Switching between clients, seeing status at a glance, testing on a client's behalf, exporting reports in bulk — the things that save a coach hours a week only exist in software built for a roster, not a single-user app bolted onto a spreadsheet.
A quick buying checklist
- ✅ Multi-method LT1/LT2 detection (not a single fixed-lactate rule)
- ✅ Branded PDF reports — your logo & studio details
- ✅ Full test history & curve-over-time comparison per athlete
- ✅ Power / heart-rate / pace zones for cycling, running and swimming
- ✅ Athlete roster with status and test-due indicators
- ✅ Training planning & analysis connected to the same zones
- ✅ Works with the analyzer and wearables you already use (Strava, Garmin)
How LaChart fits
LaChart was built for exactly this workflow. You (or your client) enter a step test; it detects LT1 and LT2 with a consensus of methods, builds the zones, and exports a branded PDF with your logo and studio name. Every test is stored per athlete with curve-over-time history, and you can plan and analyse each athlete's training against those zones — all from one coach workspace. There's a 2-week free trial on the Coach plan, so you can run a full testing-and-training cycle with real clients before you pay anything.
See the full coach workflow, the branded report and pricing on the LaChart for coaches page — or, if you want to tighten up the test itself first, start with our step-test protocol guide.
The bottom line
The analyzer measures the lactate; the software decides whether your testing becomes a professional, repeatable service or stays a spreadsheet you re-build every time. Look for real multi-method threshold detection, branded reports, per-athlete history, and a direct line from test to training plan — that's the difference between calculating a number and coaching with it.