The curve, and the number you can defend.
Type the stages as you run them. LT1 and LT2 come back by six methods at once, with the measured points on top and the lactate and heart rate at each.
Six methods, side by side
Log-log, IAT, OBLA 2.0–4.0, baseline offsets, D-max and LTP computed on the same data, with the measured points drawn on top. A consensus you can argue from, not one formula’s guess.
Bike, run and swim
Watts, minutes per kilometre or minutes per hundred metres; step or distance stages; metric or imperial. Switch sport and the thresholds, units and zones all follow.
Test against test
Curves overlaid across visits with the shift in LT1 and LT2 called out — the thing a returning client is actually paying to see, and the thing that tells an athlete the block worked.
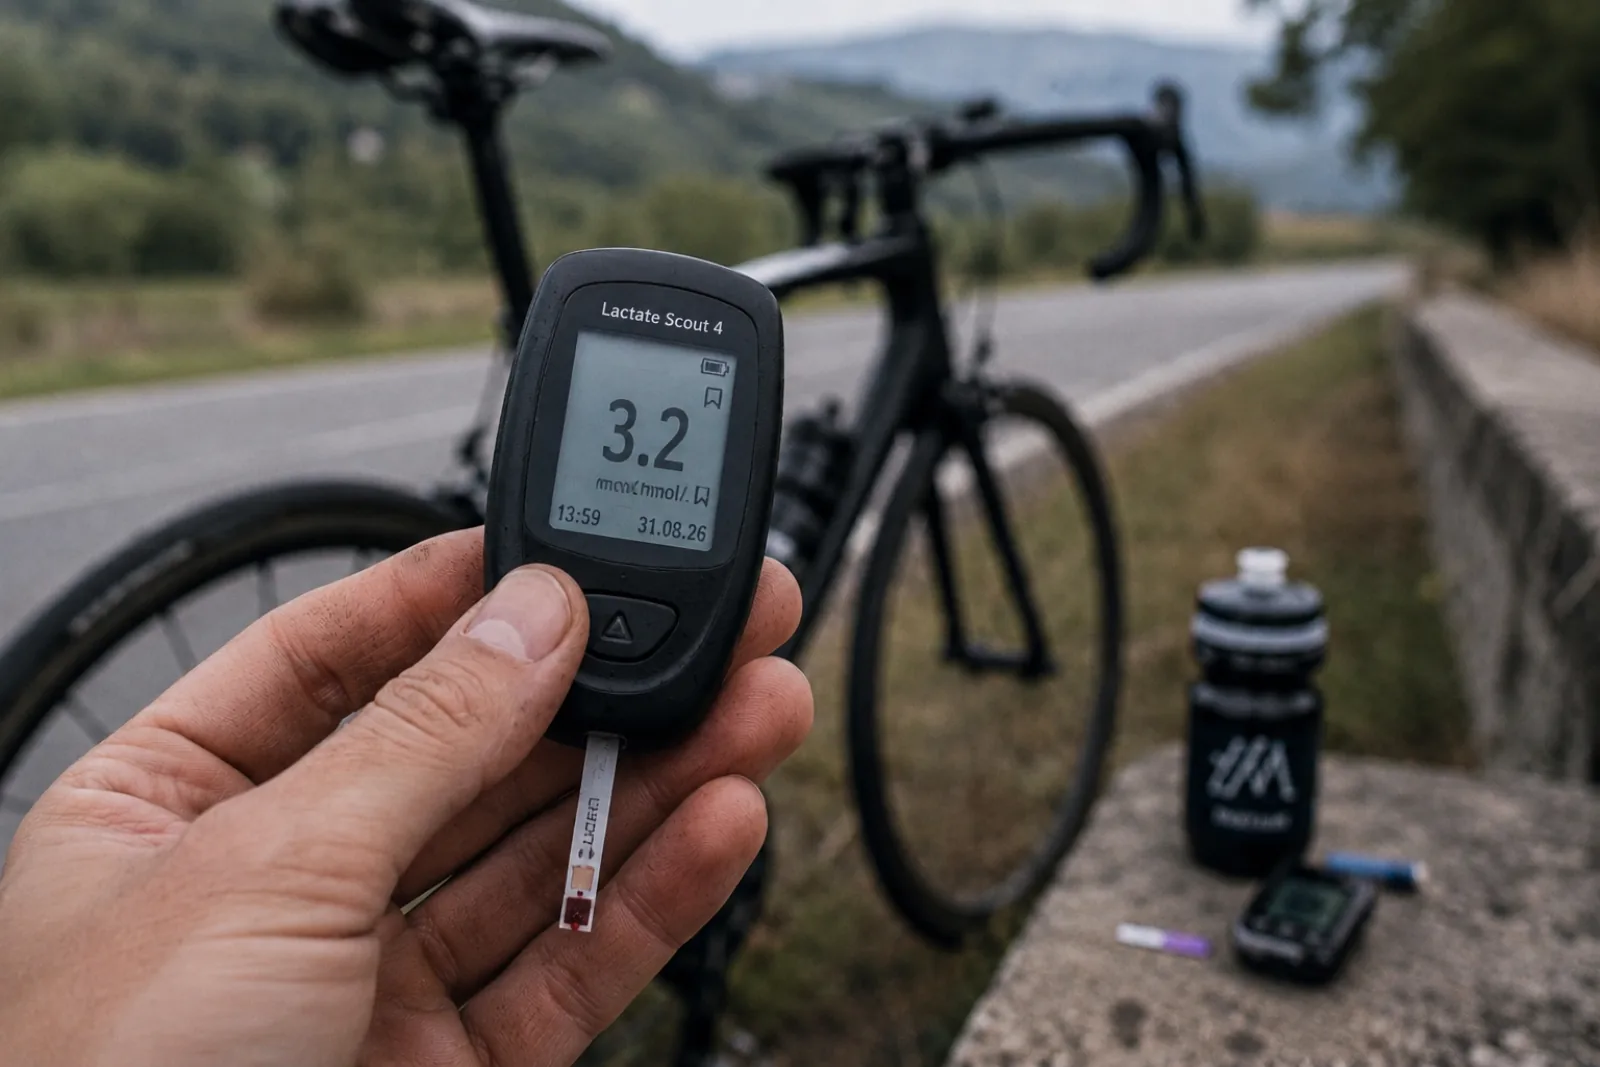
In the lab or at the roadside
A full step test in a studio, or a single sample taken mid-session and compared against your own curve. The same lactate at a higher intensity is the curve moving right.
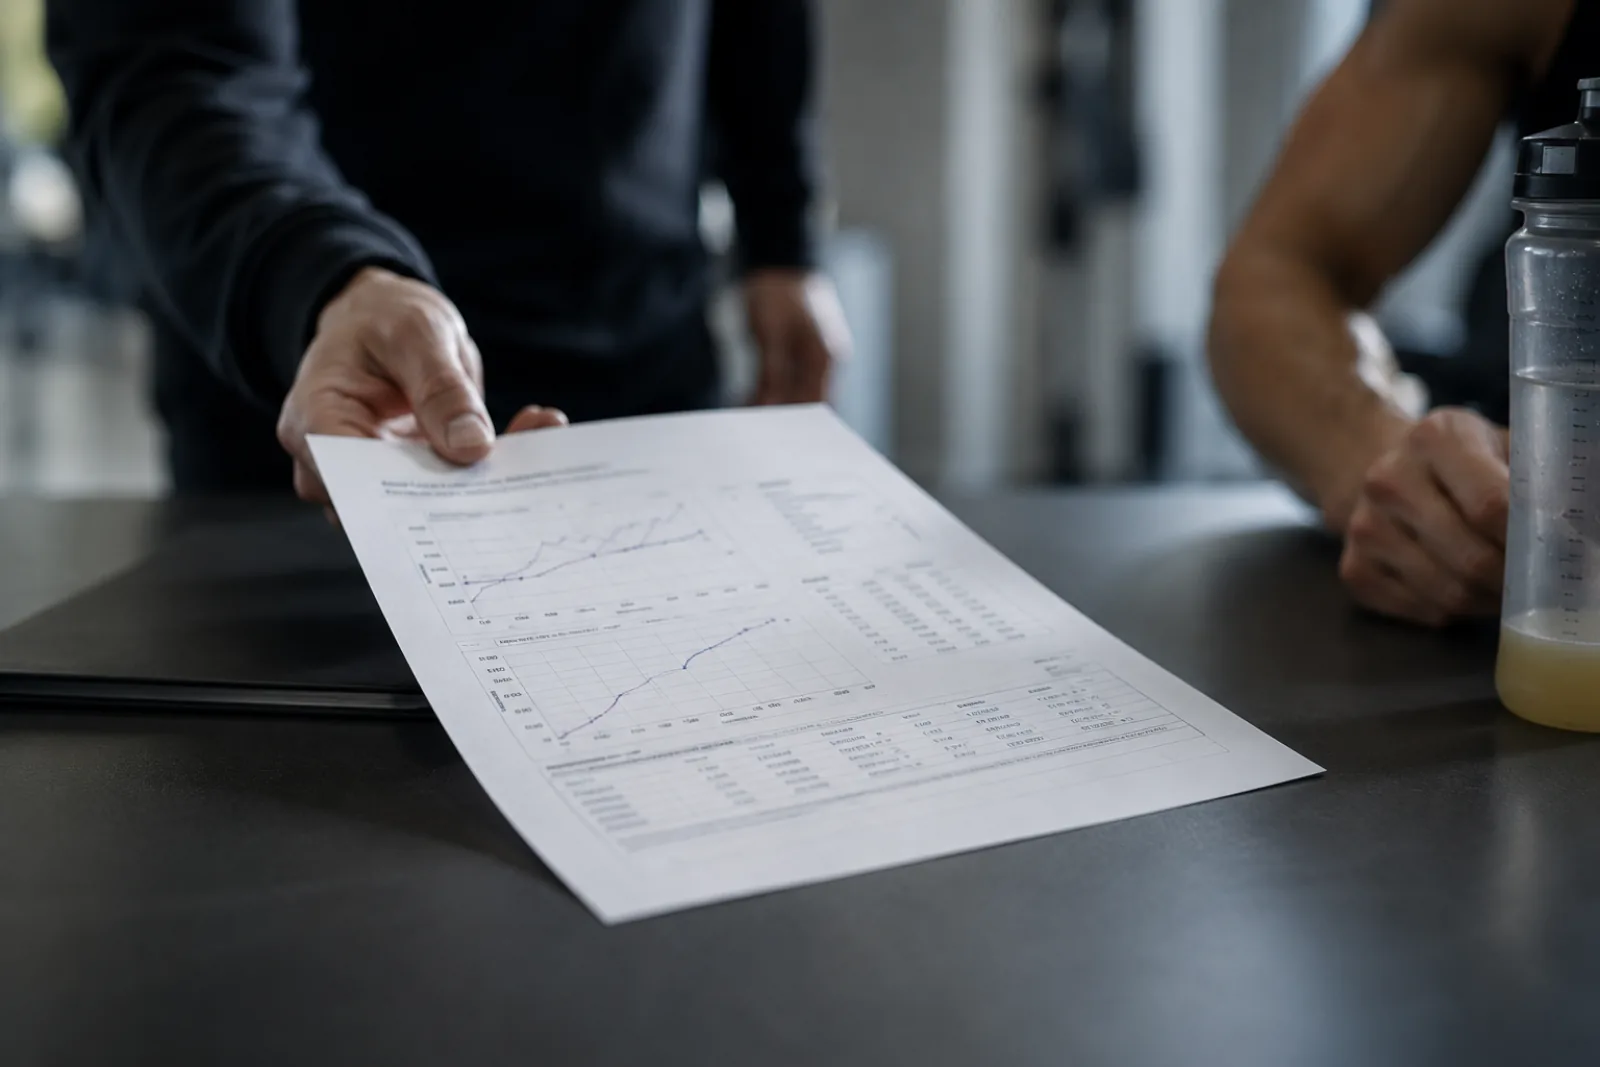
A report with your name on it
Every threshold method with the power, heart rate and lactate at each, exported as a PDF carrying your logo, your studio name and your contact details. It is your document; LaChart draws the curve.
Other features
Two weeks, nothing charged today
Connect a device, enter a test, and see your own numbers in it. Cancel whenever.
Start free