You take the blood. We draw the curve.
Type the stages as you run them and get LT1 and LT2 by six methods, the zones that follow, and a PDF with your logo on it to hand the client before they leave. Three tests a day, every one saved to that person forever.
- No Strava or Garmin connection
- No device for the client to own
- No training data required
- The test is the whole job
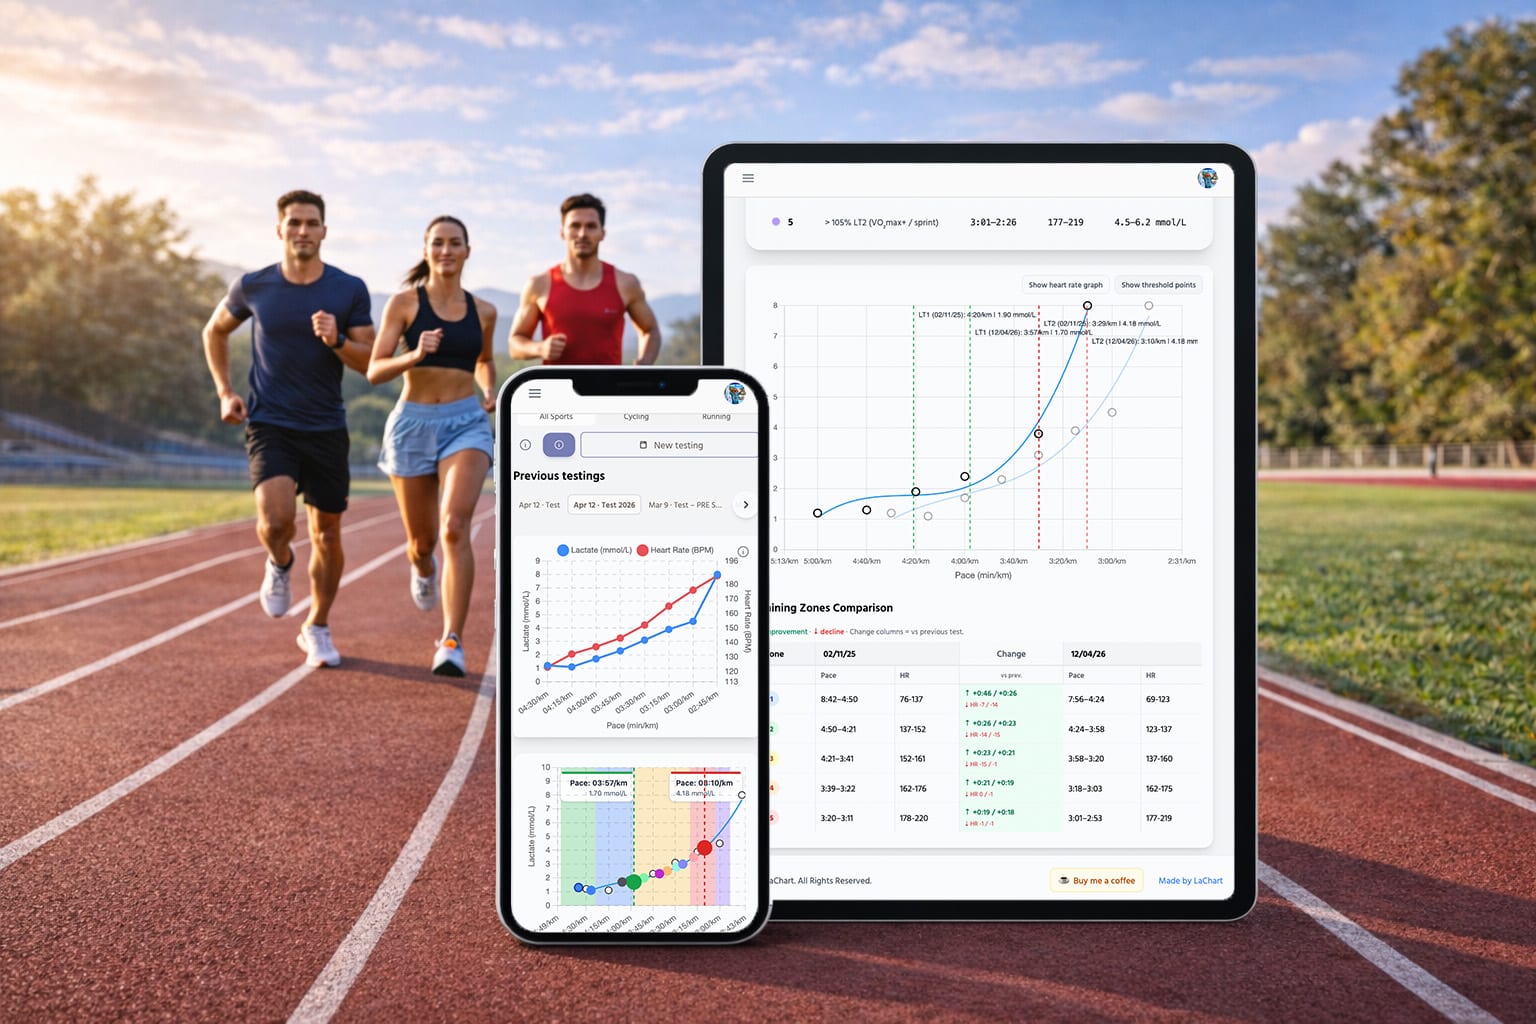
From a drop of blood to a document
Four steps, and the client is holding the result before they have changed.
Enter the test
Type the stages as you run them — load, lactate, heart rate. Power for the bike, pace for the treadmill, per-100m for the pool.
Read the curve
LT1 and LT2 by log-log, IAT, OBLA, D-max and LTP at once, with the measured points on top. A consensus, not one formula’s guess.
Hand it over
A PDF carrying your logo, your studio name and your contact details. The client walks out with it.
They come back
The next test lands beside the last one — both curves on the same axes, and what moved between them.
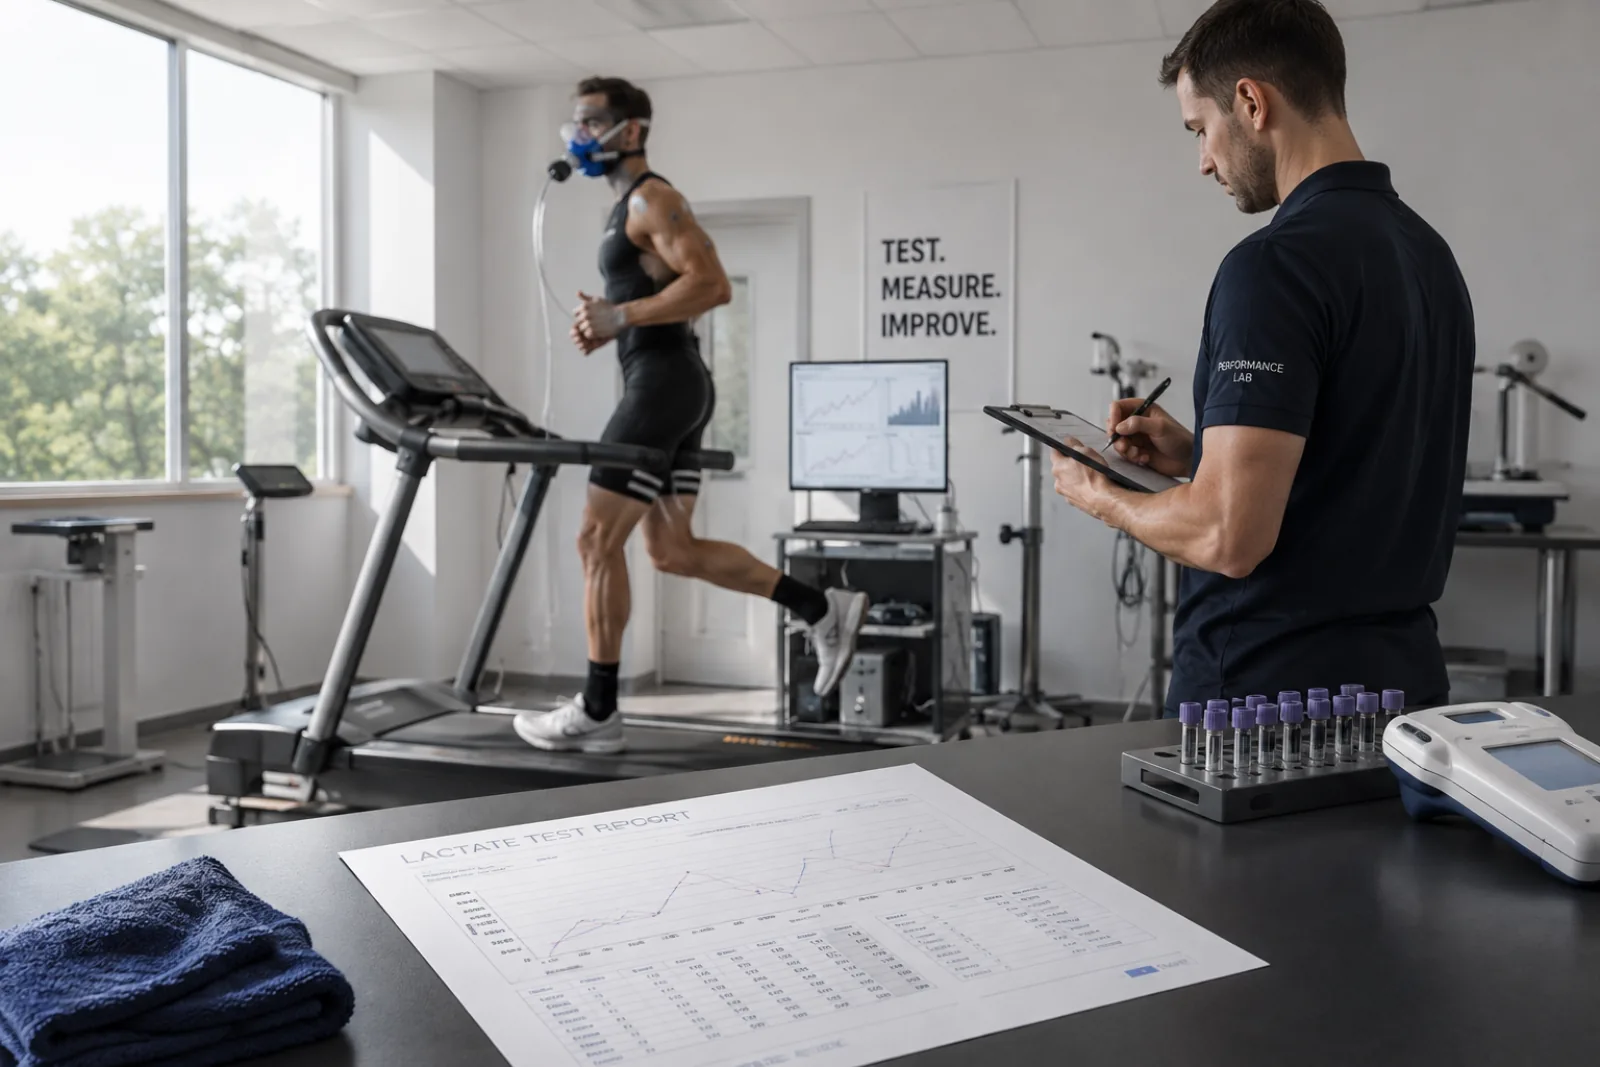
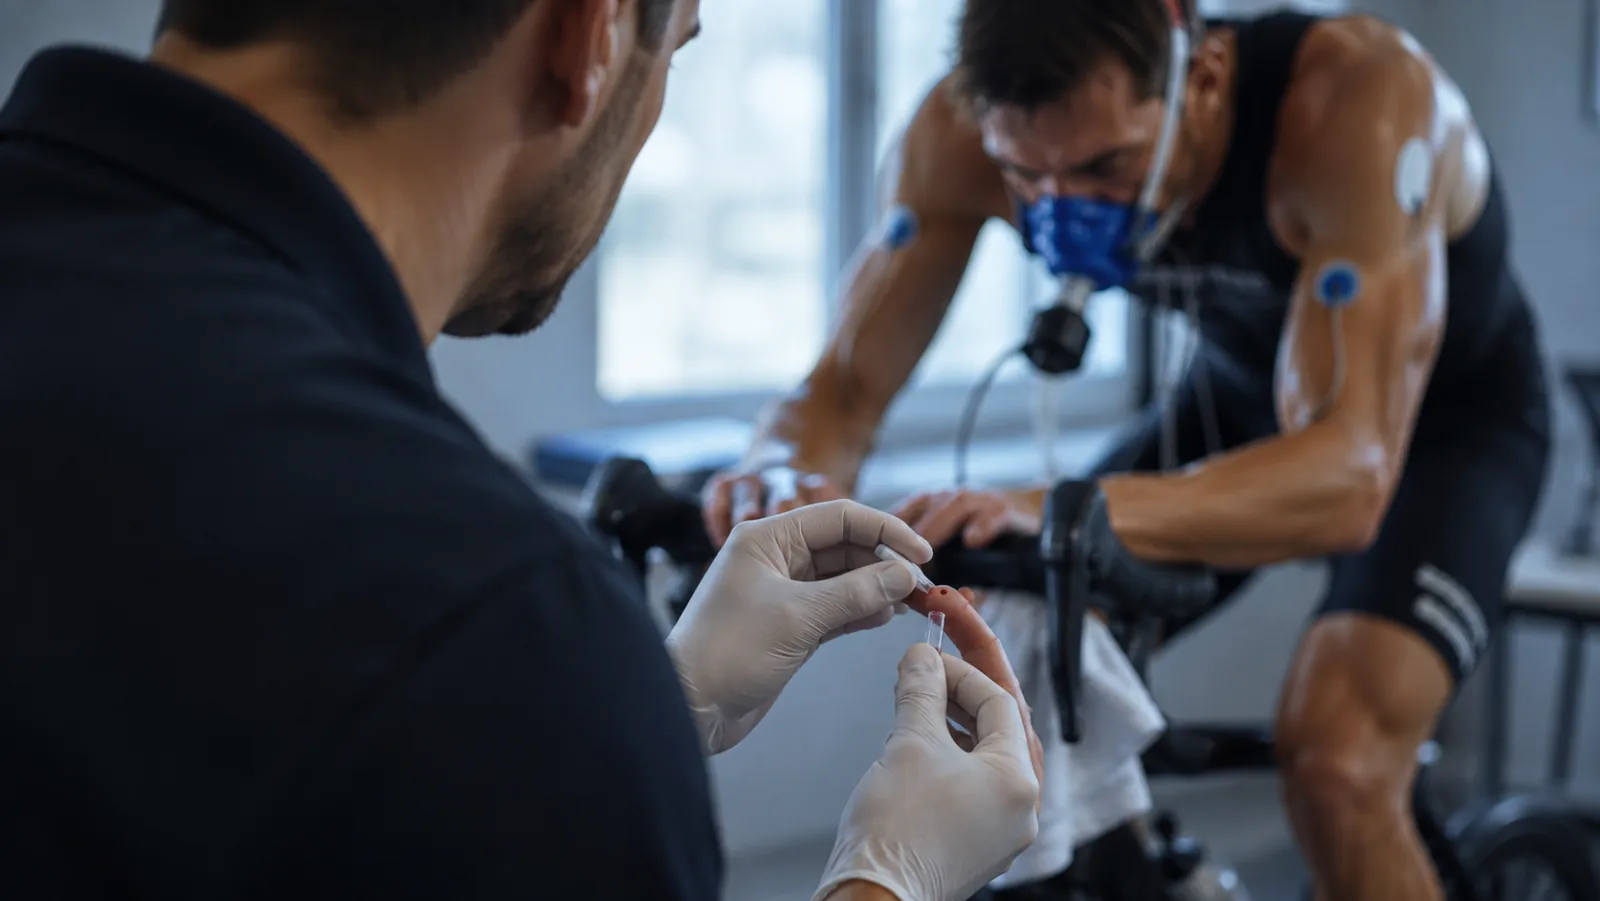
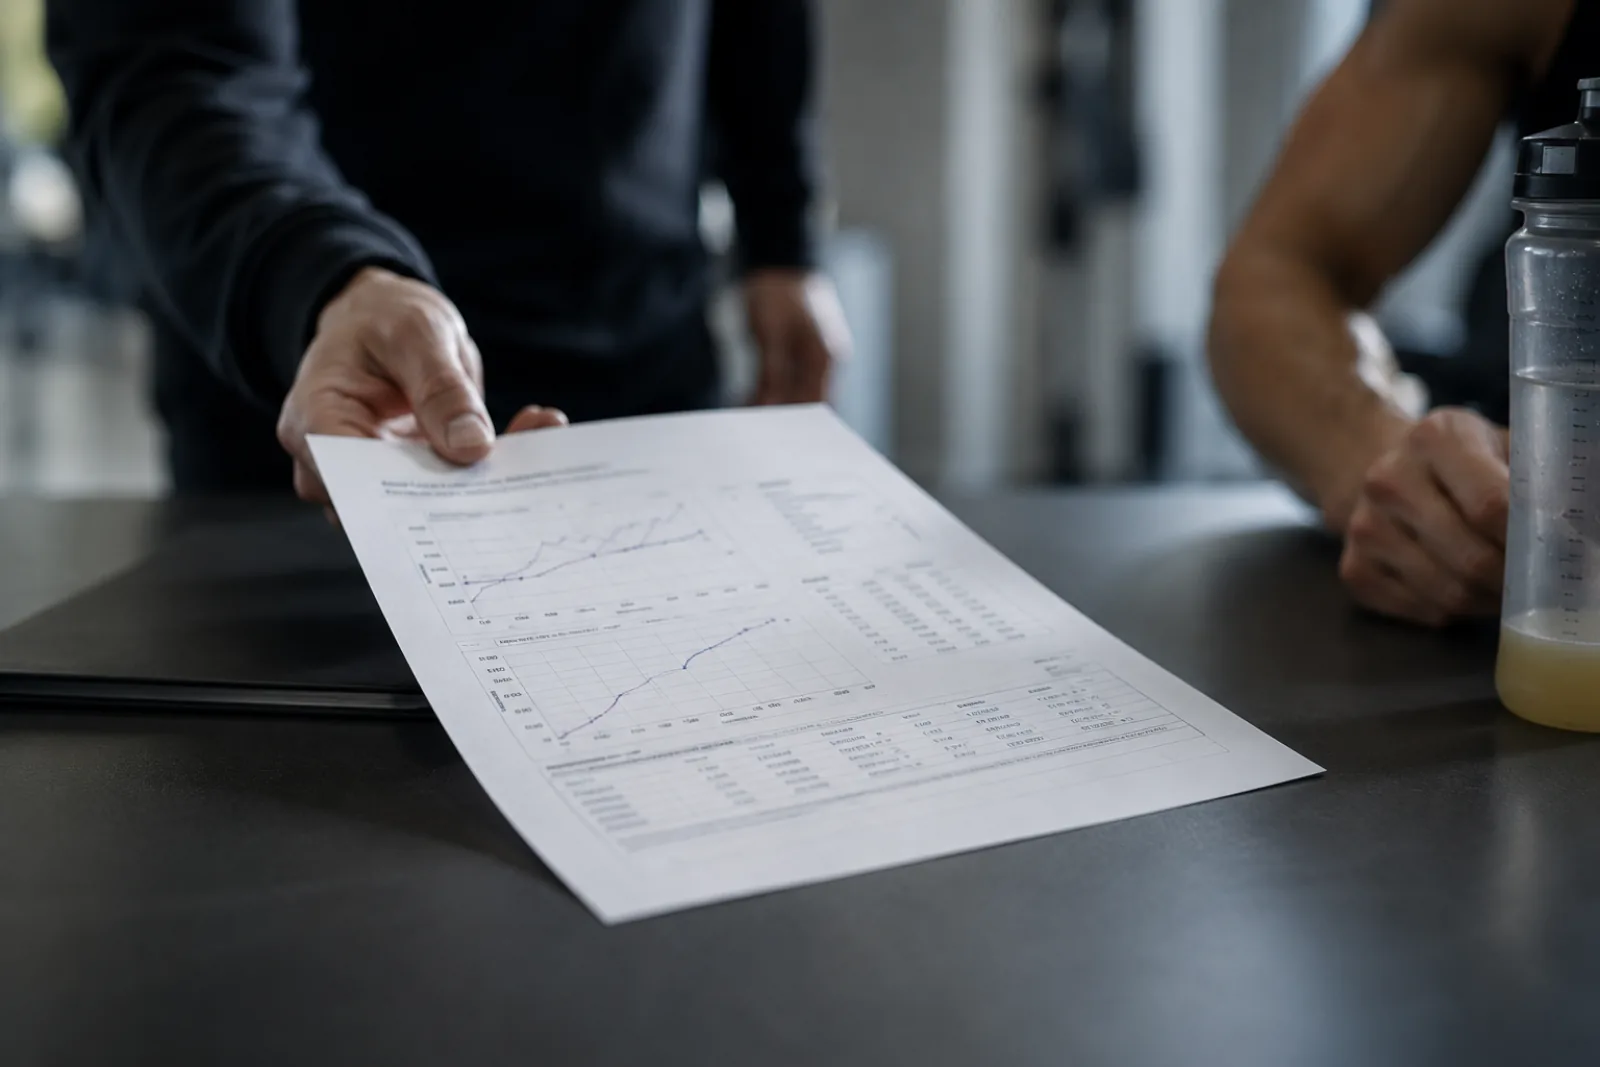
What the client walks out with
The report is the thing they paid for, so it carries your name — not ours.
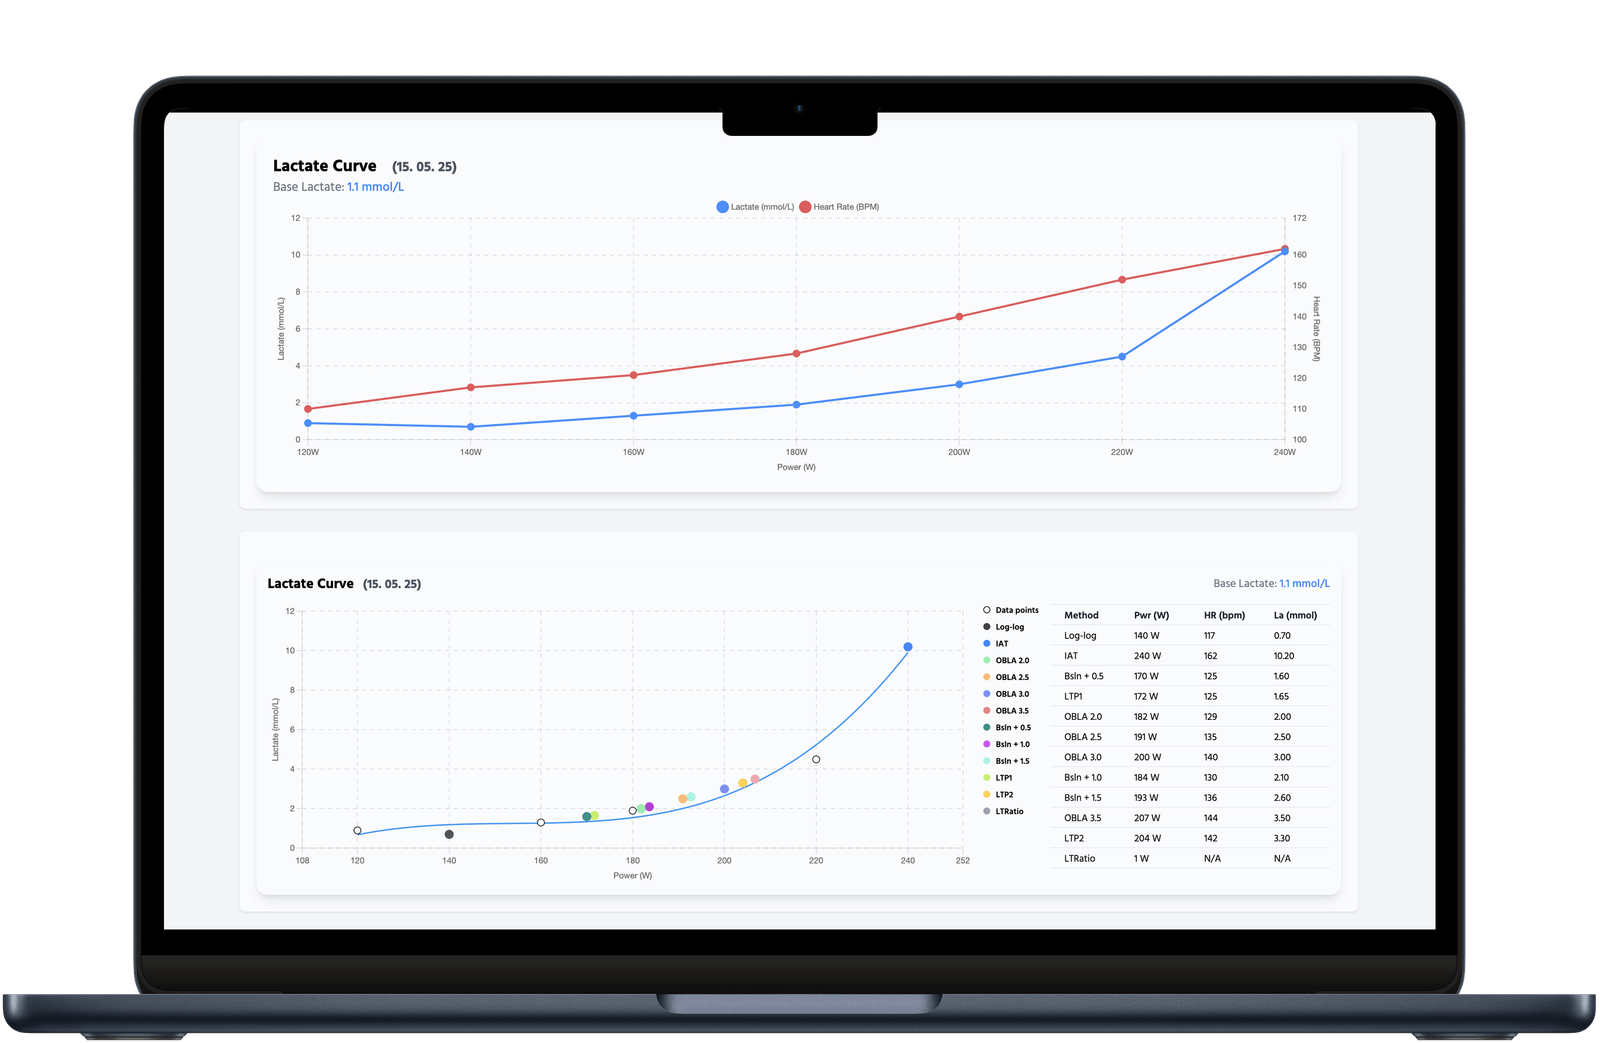
Every threshold method with the power, heart rate and lactate at each — so the number you chose is one you can defend.
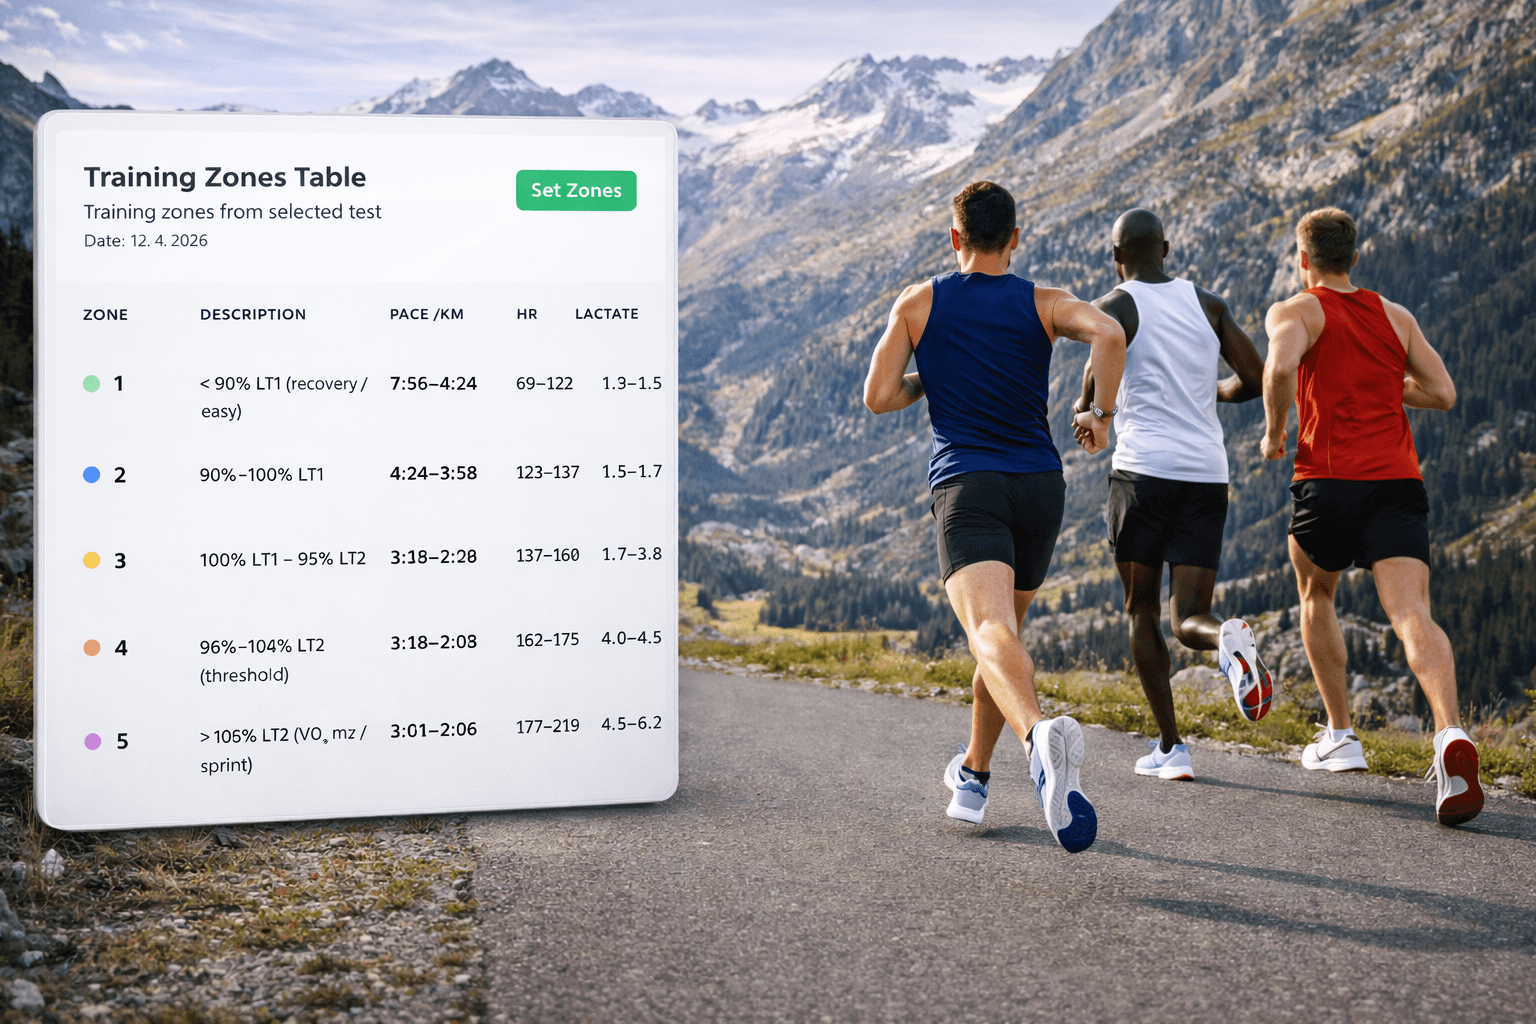
Power, pace and heart-rate zones computed from the thresholds you just measured.
Built for the person holding the lancet
Every client, one workspace
Add a person, enter their test, done. No invitation to accept, no app for them to install, no account for them to remember.
Your name on the report
Logo, studio name and contact on the PDF. It is your document; LaChart just draws the curve.
Six threshold methods, side by side
Log-log, IAT, OBLA 2.0–4.0, baseline offsets, D-max and LTP — with the lactate and heart rate at each, so you can defend the number you chose.
Zones out of the test
Power, pace and heart-rate zones generated from the thresholds you just measured, ready to paste into whatever the client trains with.
Test against test
Curves overlaid across visits, with the shift in LT1 and LT2 — the thing a returning client is paying to see.
Bike, run and swim
Watts, minutes per kilometre or minutes per hundred metres. Step or distance stages, metric or imperial.
The real thing, not a screenshot
These are the components out of the app. Click a stage on the curve, switch sport, pick a zone — or read lactate testing and zones & thresholds in detail.
28%
22%
11%
30%
9%
€14.99 / month
Unlimited people tested, unlimited tests, unlimited reports. Two weeks free, no card charged today, cancel whenever.
Start testing