Try calculating lactate thresholds for free — no sign-up neededTry demo
For coaches & athletes
Lactate testing app and training platform
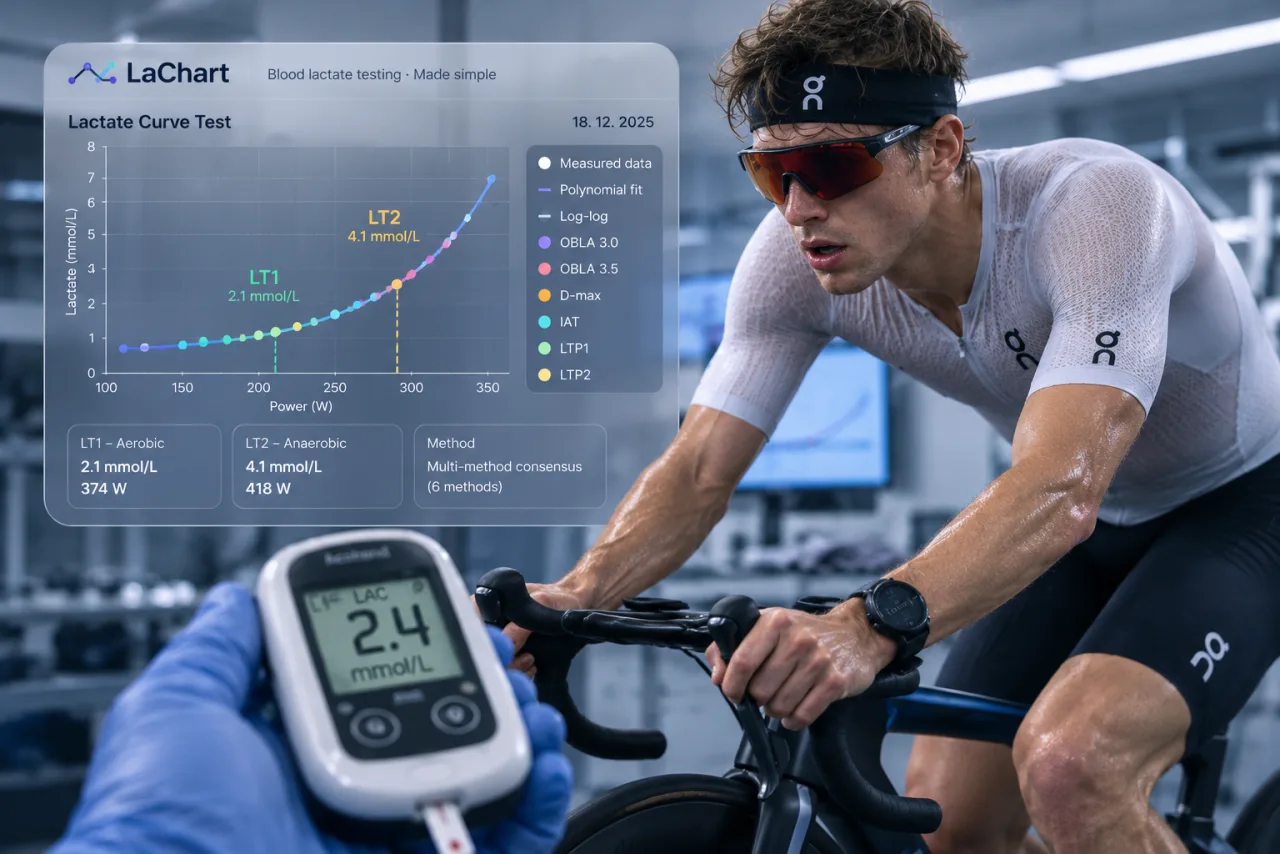
Run the test, get LT1 and LT2 by six methods, and turn them straight into zones. Then use them: rides, runs and swims arrive on their own from Strava, Garmin or Apple Health, you read load and form, laps and peaks, and next week goes back out to the watch — all of it anchored to numbers you measured, not a percentage of a guess.
LT1 / LT2Zones & PDF reportCalendar & plannerLoad & form
Lactate testing for cyclists, runners & triathletes
From the first home lactate test to a full coaching workspace — LaChart fits the way you train.
Coaches
Manage multiple athletes, view historical lactate tests, track training calendars, and monitor lactate values from workouts.
Athletes
Generate lactate curves, calculate training zones, track progress over time, and record lactate to intervals.
Cyclists
Test with power, calculate zones, sync from Strava, and analyze TSS and training load.
Triathletes
Test with pace, track improvements across the same workouts over time, and compare historical tests.
Three workspaces · one app
Athlete, coach & tester workspace
LaChart adapts to how you use it — train yourself, manage athlete lactate tests, or run tests for clients. Same data, three completely different shells.
For athlete
Train yourself. Tap your numbers.
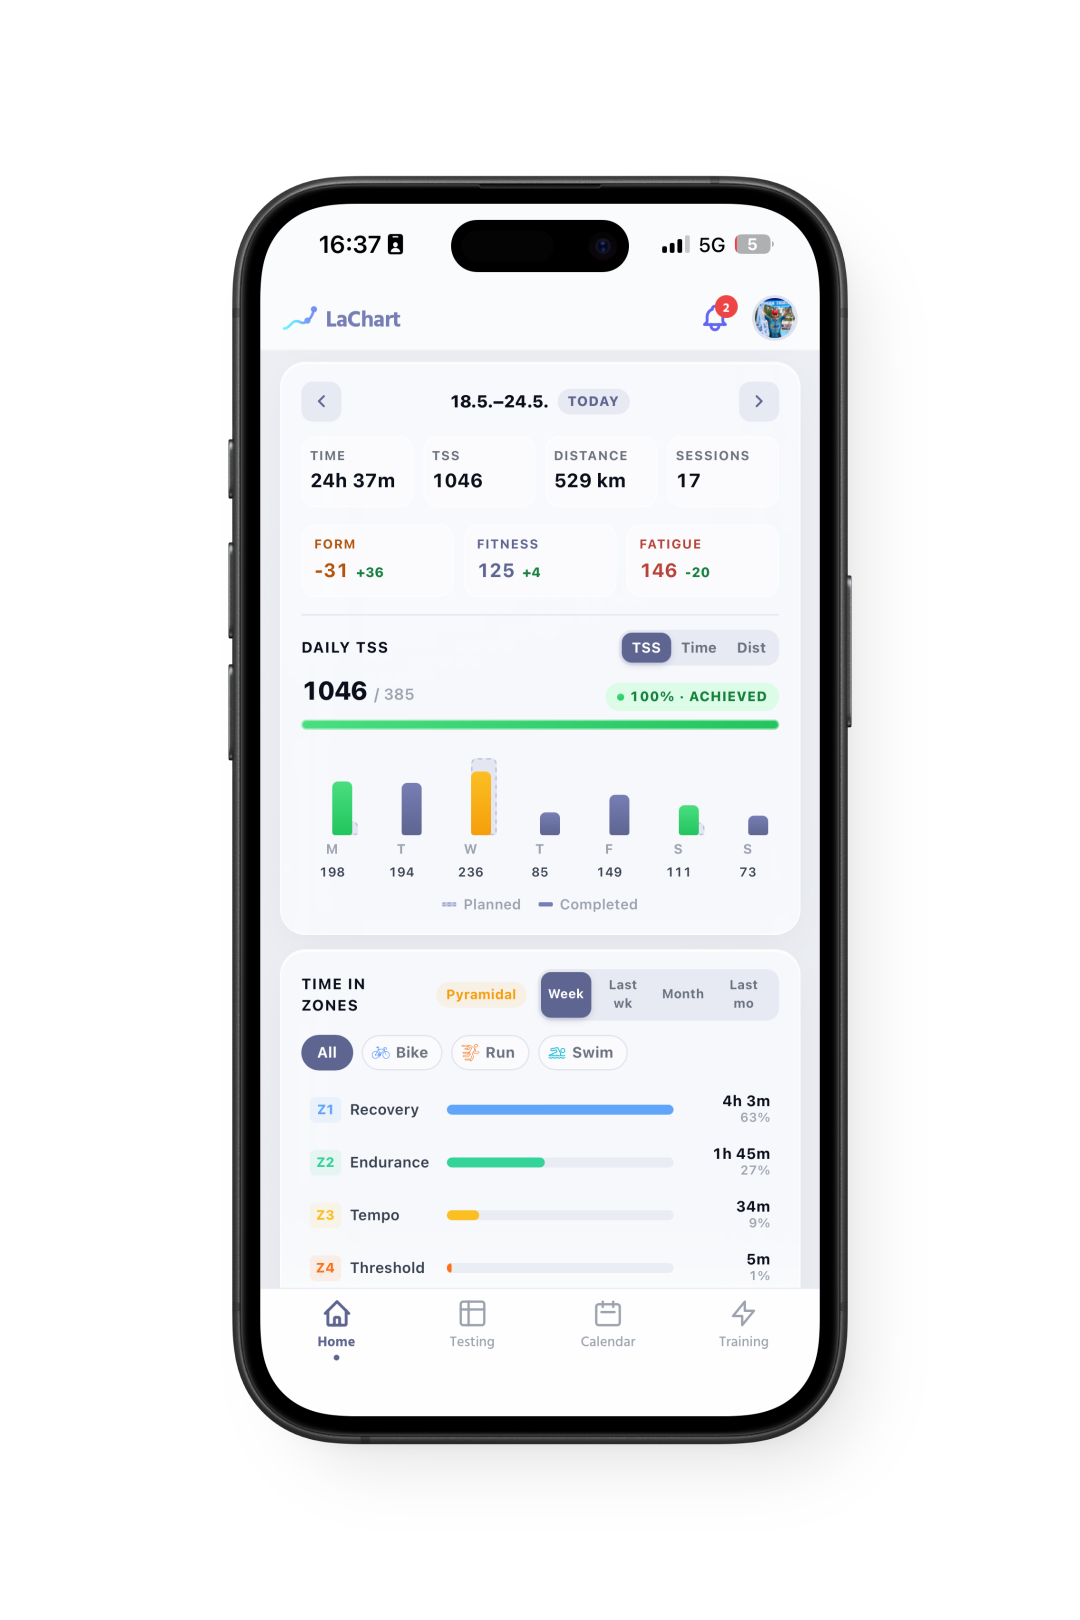
A calm dashboard built around today. Form and fitness at a glance, threshold trend over months, every interval ready for a lactate sample. Mobile-first.
Form ring · TSB — fresh, optimal, productive, overreaching, in plain English.
Today's training — above the fold — open, do, log lactate, done.
Tap any interval — to log a blood sample — your curve learns.
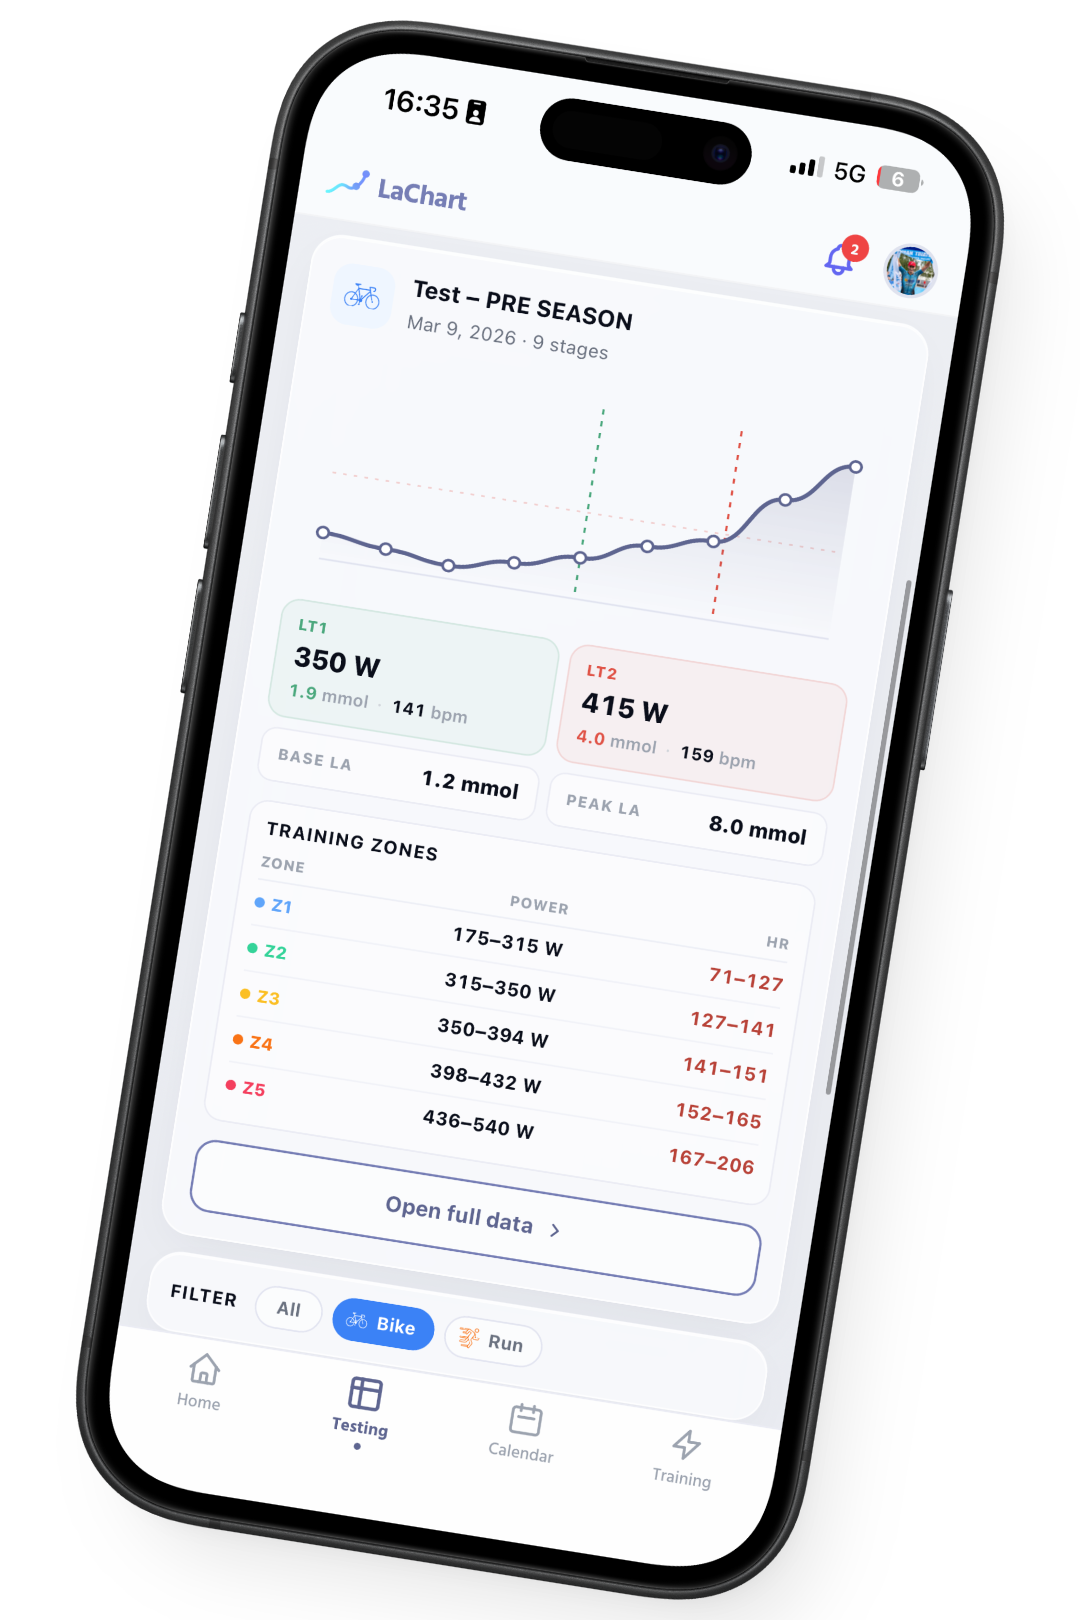
Threshold trend — over weeks — LT1 and LT2 moving right.
Native iOS app — bottom tabs, swipe between sports, Apple Health sync.
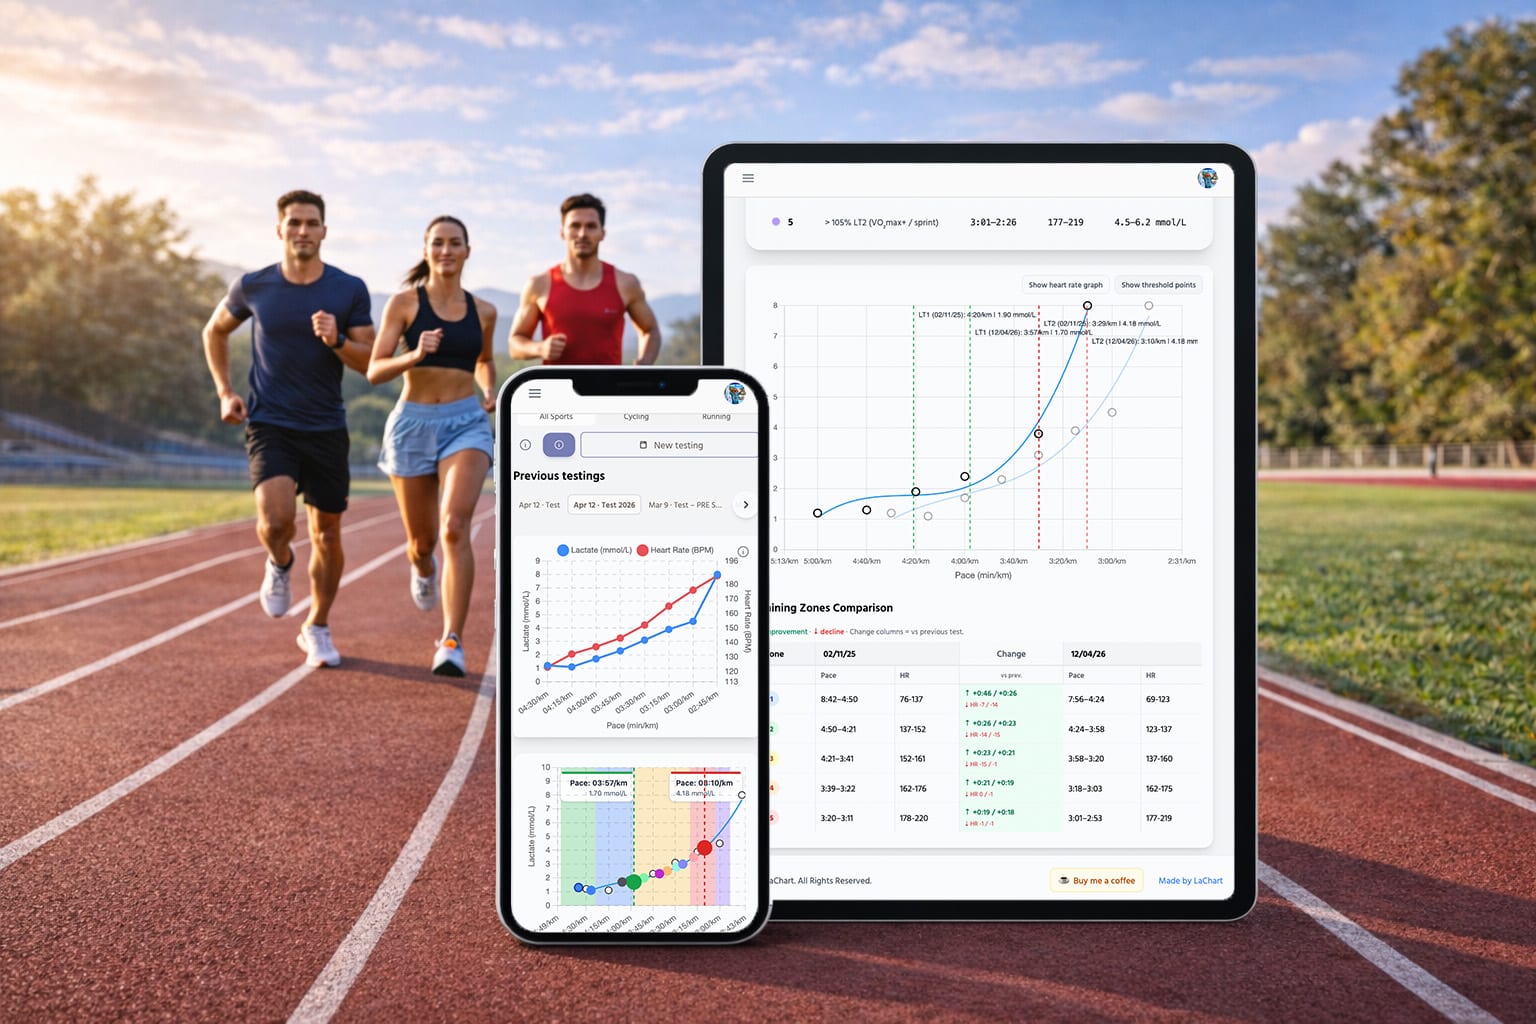
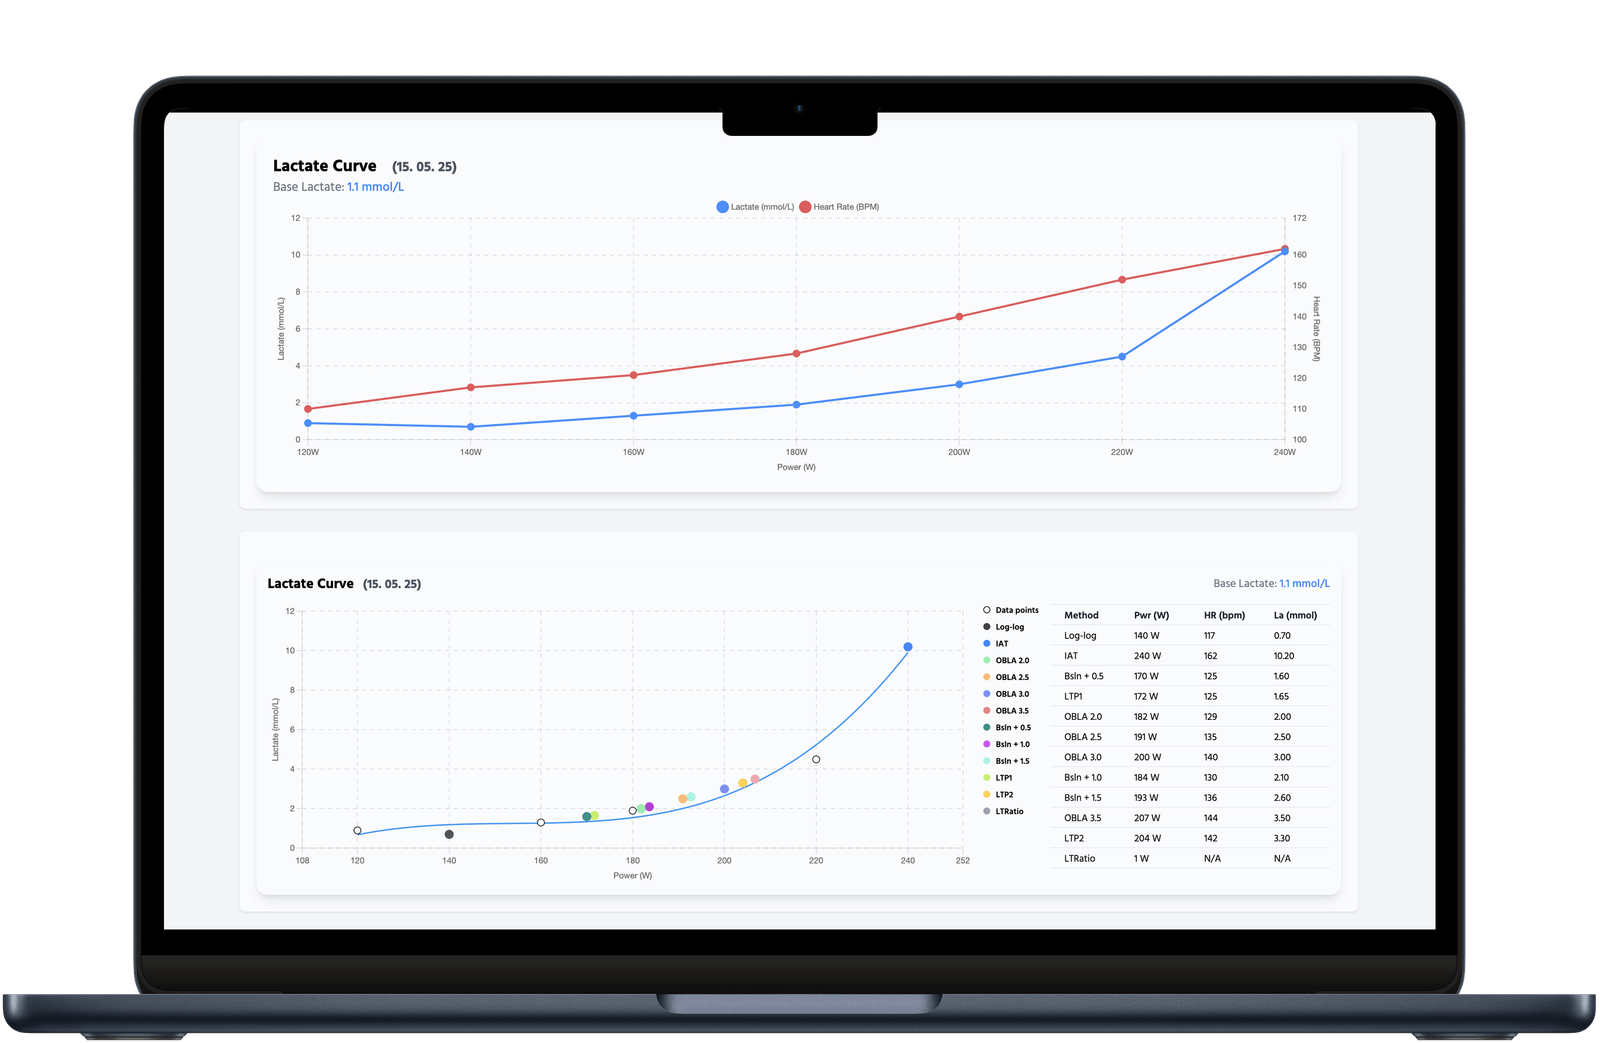
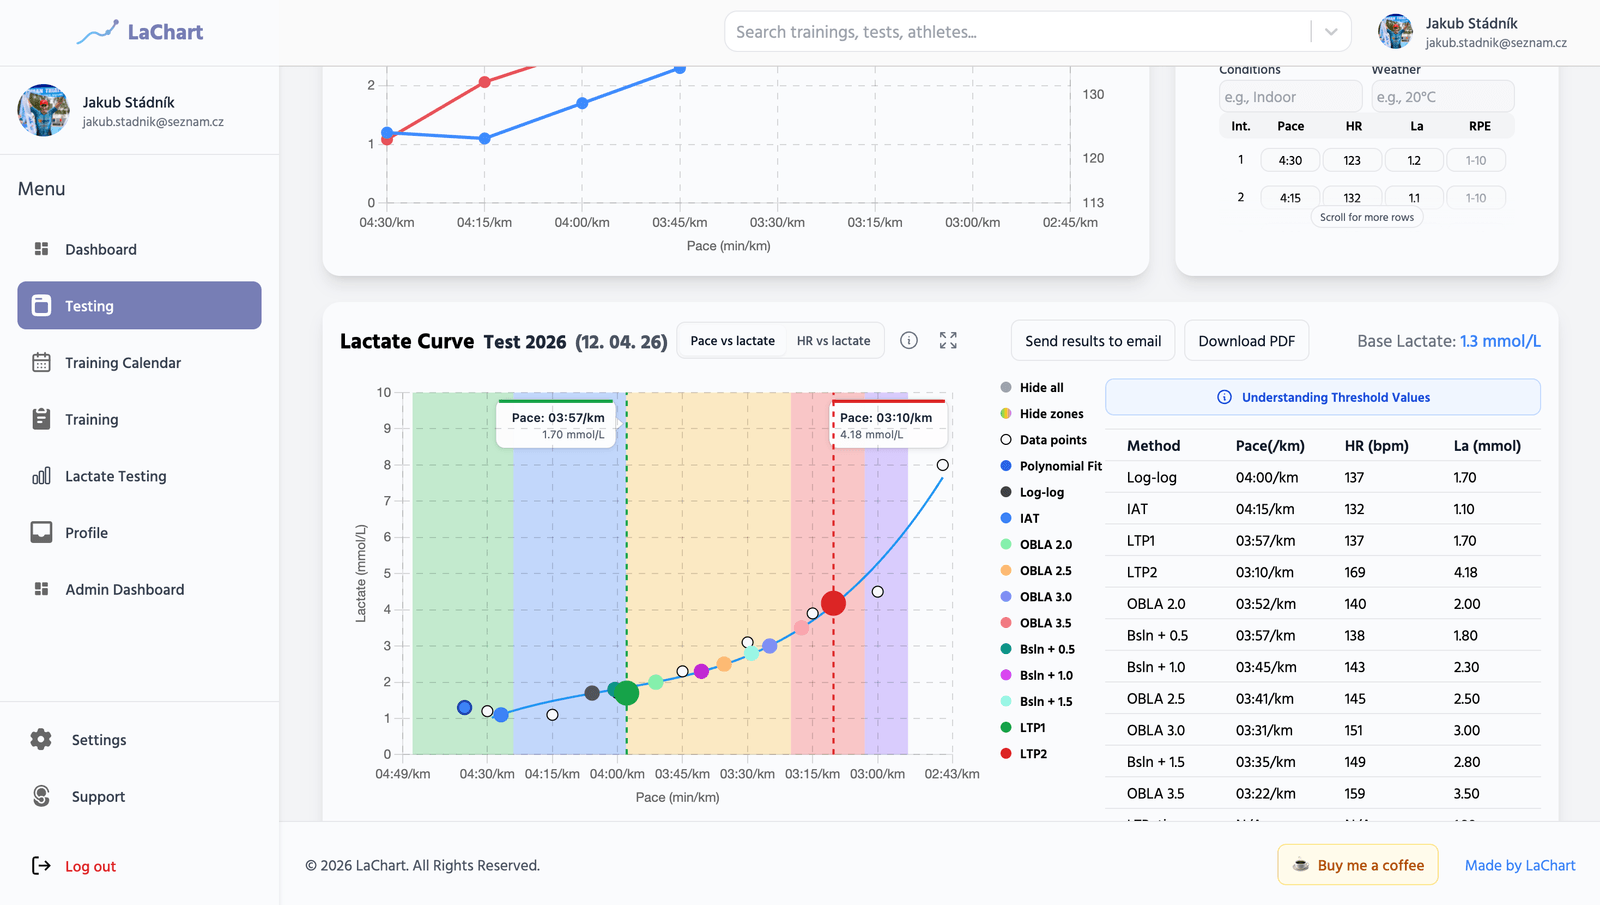
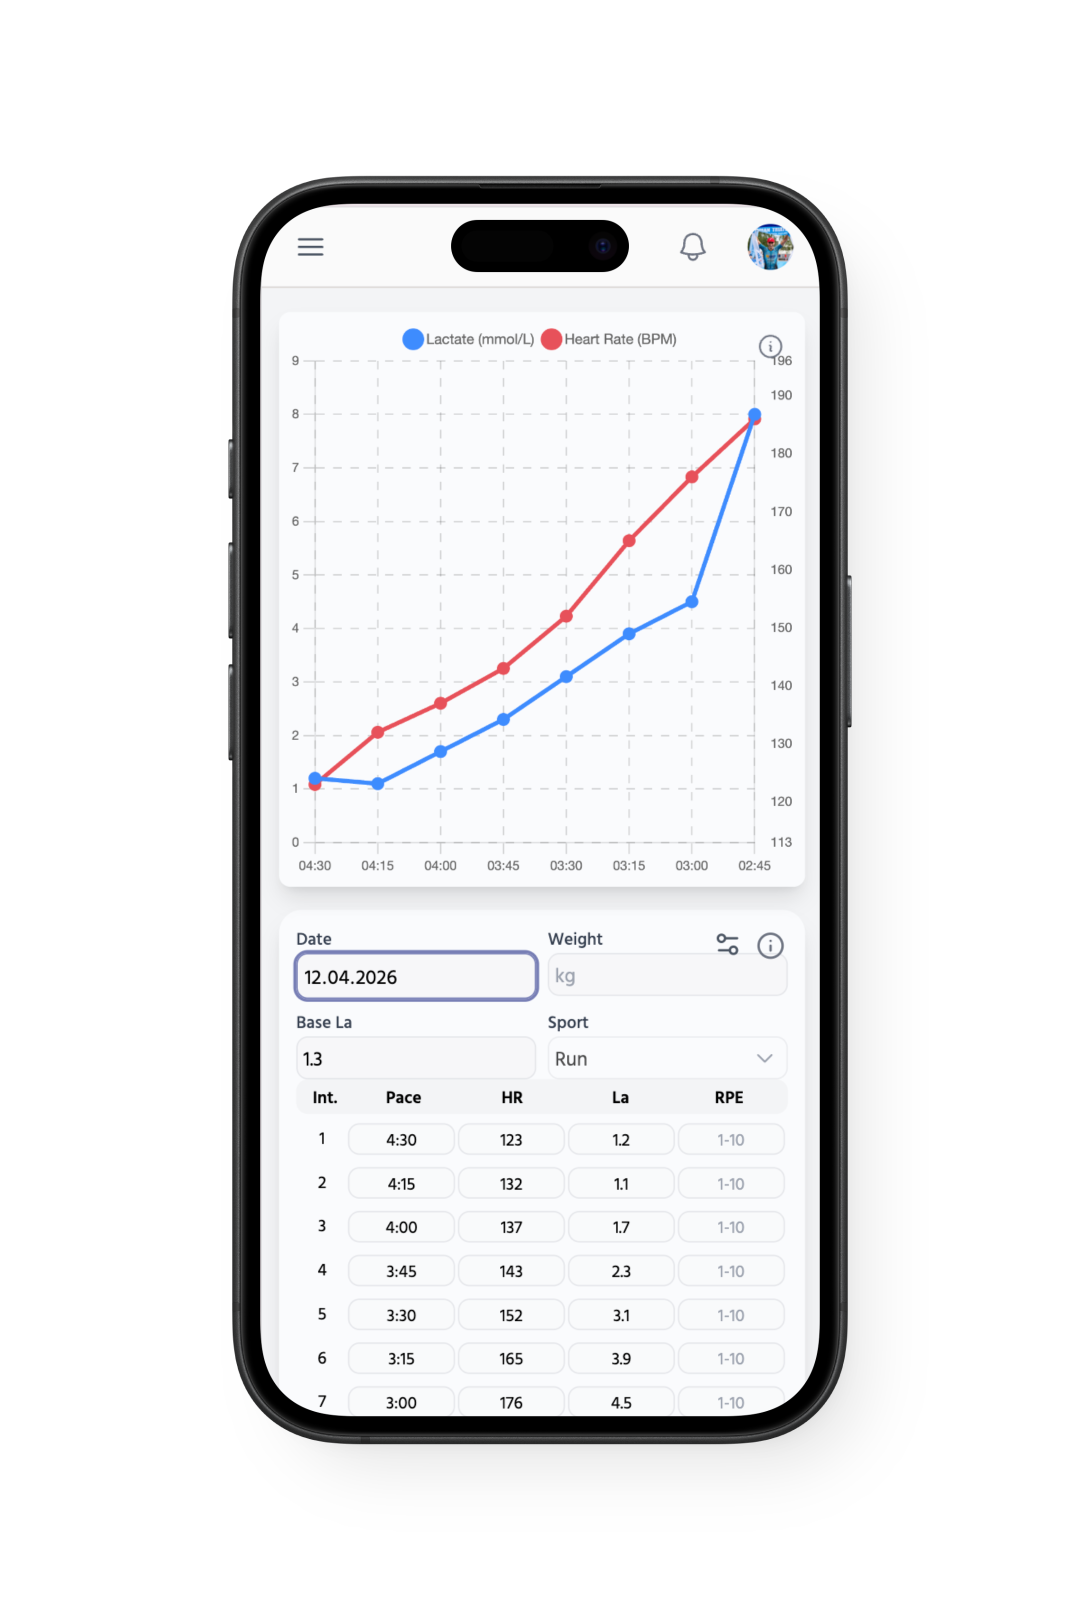
Enter your test values — power, heart rate, lactate, pace — and instantly generate the lactate curve. Calculate all critical thresholds in one interactive graph.
Step or ramp protocol — any test design
LT1, LT2, OBLA, IAT, D-max, log-log calculated in parallel
Baseline adjusts for individual resting lactate
LT1 & LT2OBLA 2.0–3.5IATD-maxLog-log
lachart.net — Lactate Curve · Power vs Lactate
Zones
Train inside your zones, not someone else's
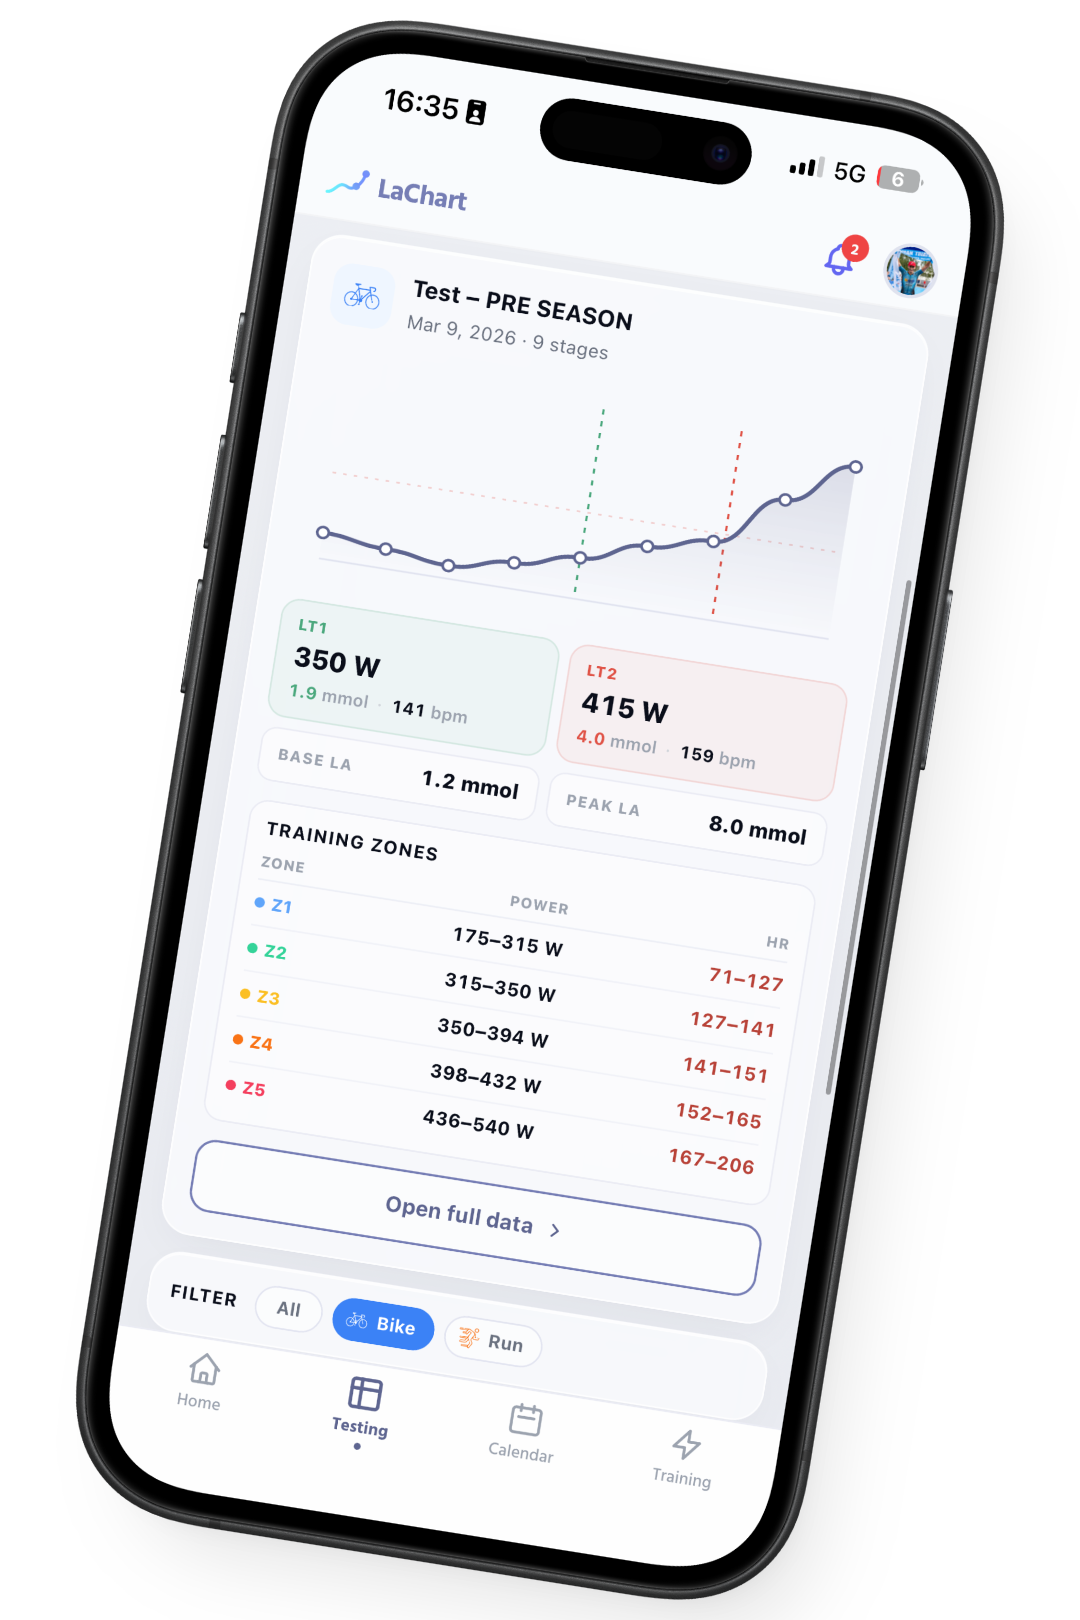
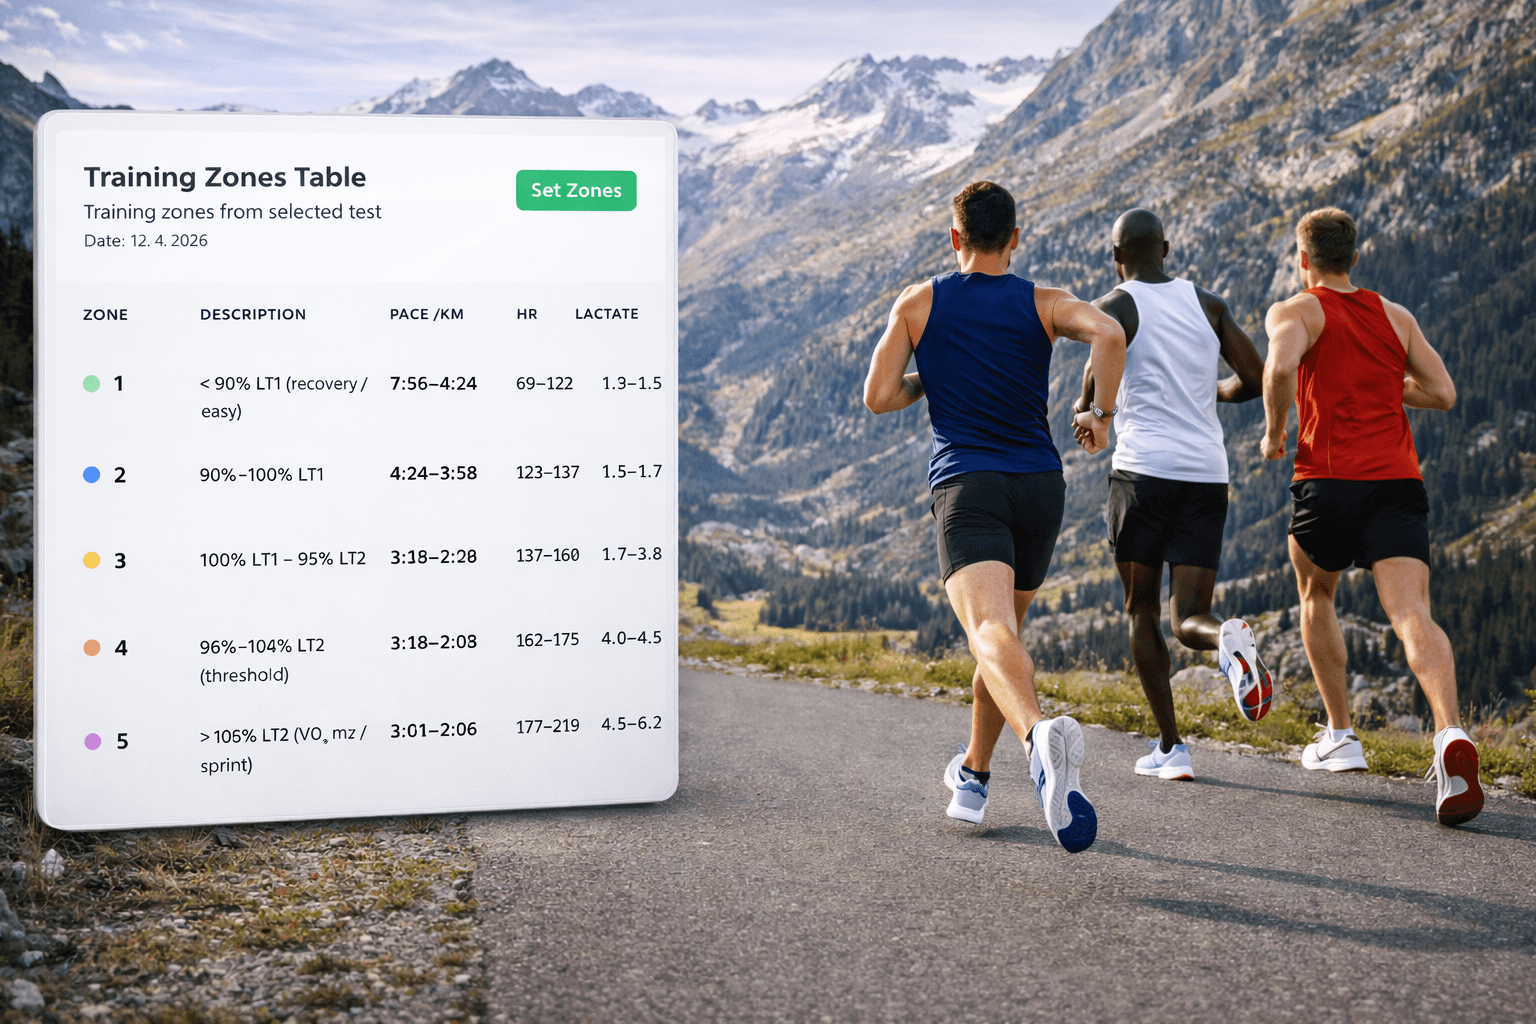
Your zones are derived from your last lactate test — power, pace and heart rate side by side. Update the test, zones update everywhere.
5-zone or Seiler 3-zone models
Power, pace and HR per sport
Auto-updates when a new test is recorded
lachart.net — Training Zones
Progress tracking
Historical test comparison
Overlay multiple lactate tests to visualize your progression. Watch your LT1 and LT2 move to higher intensities as your fitness improves.
Compare multiple test curves on one chart
Track zone shifts over training seasons
Visualize threshold improvements
Export comparison PDF reports
lachart.net — Lactate Testing
Form & fitness
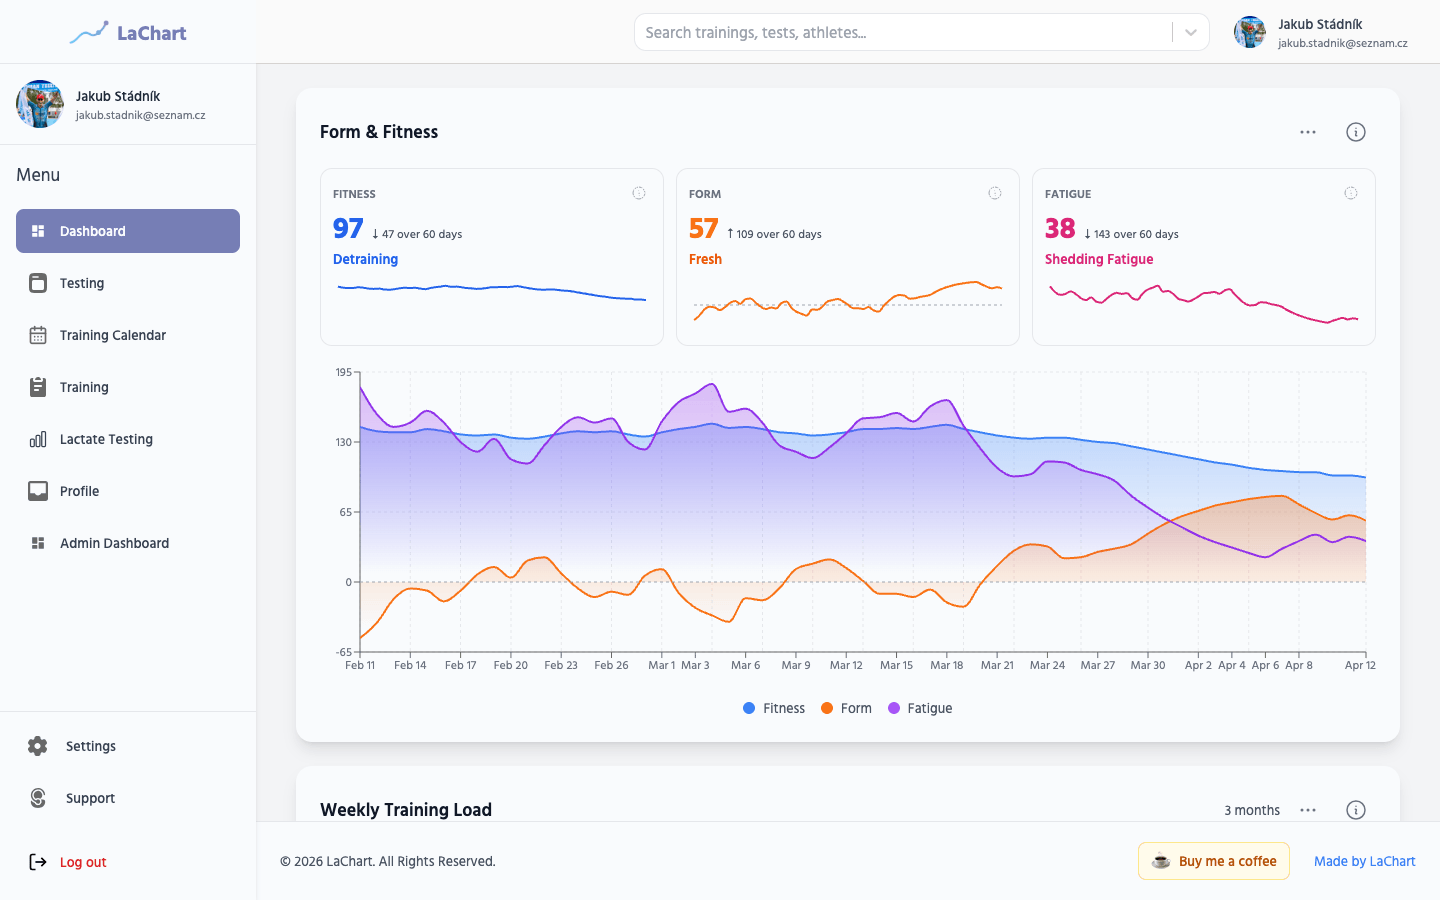
Read your fitness, fatigue and form at a glance
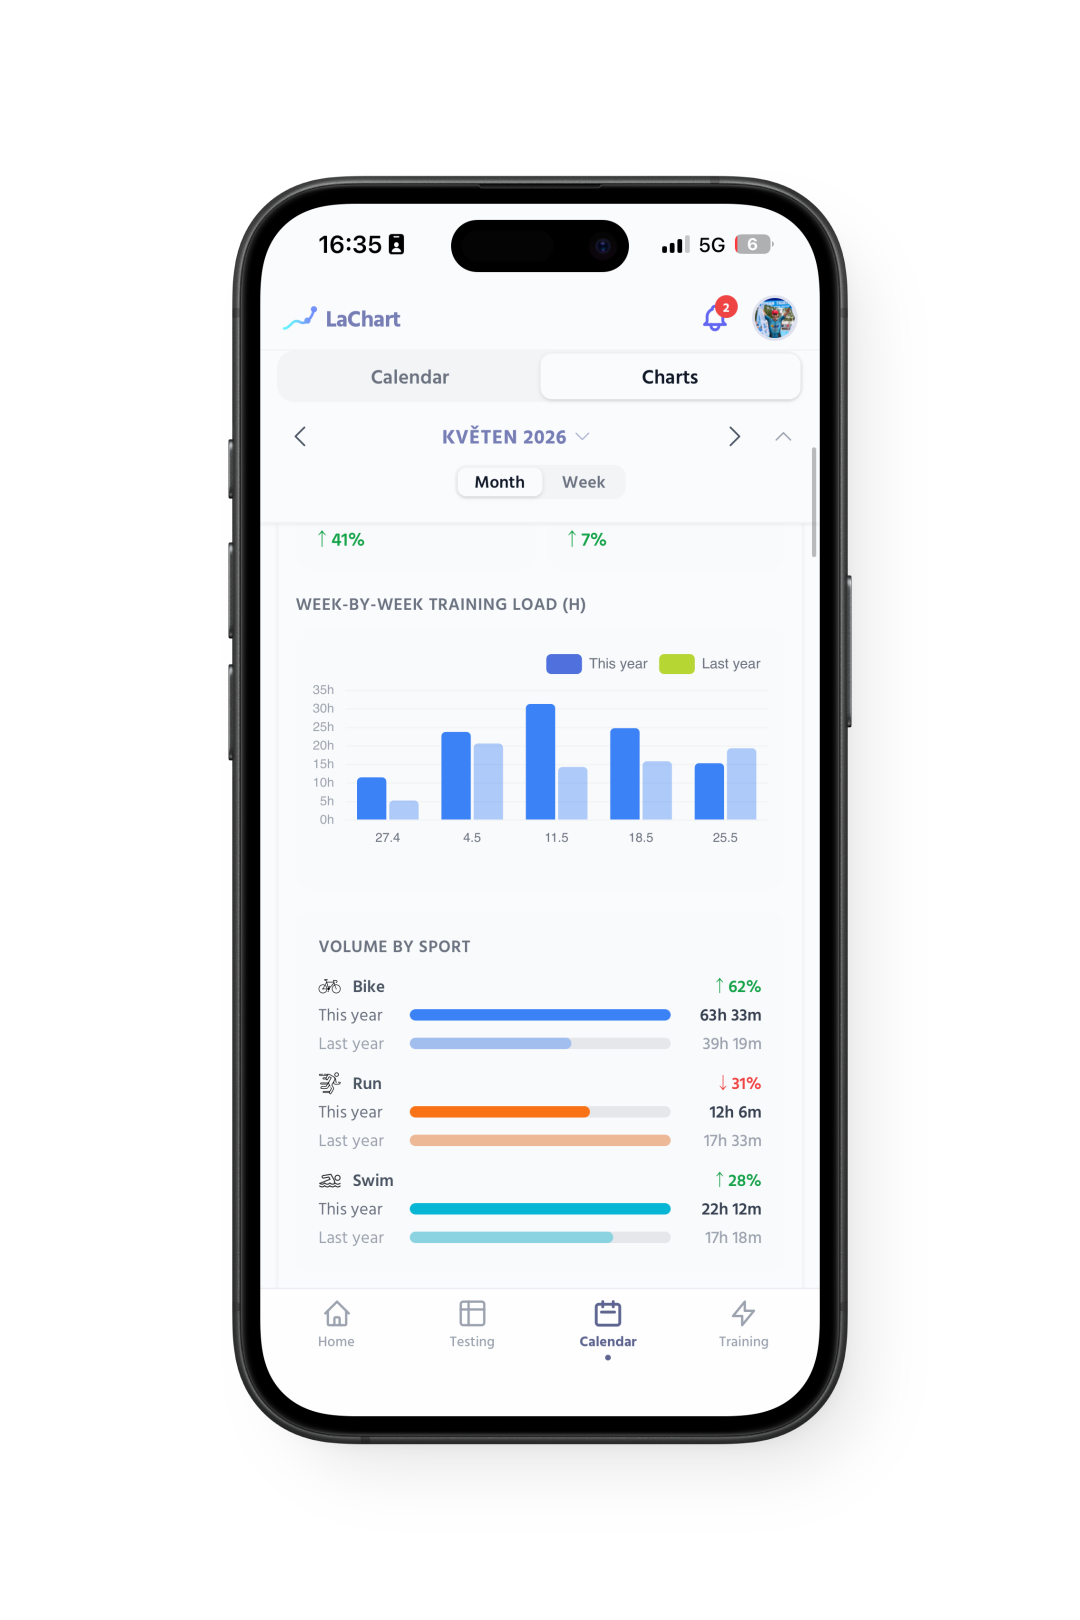
CTL, ATL and TSB tracked every day. A plain-English status word — fresh, optimal, productive, overreaching — so you always know what today's training should be.
Auto-updated from every Strava or FIT activity
14-day, 6-week and 3-month views
Plan race peaks around predicted form
lachart.net — Dashboard
Training log
Every interval, with a lactate dot
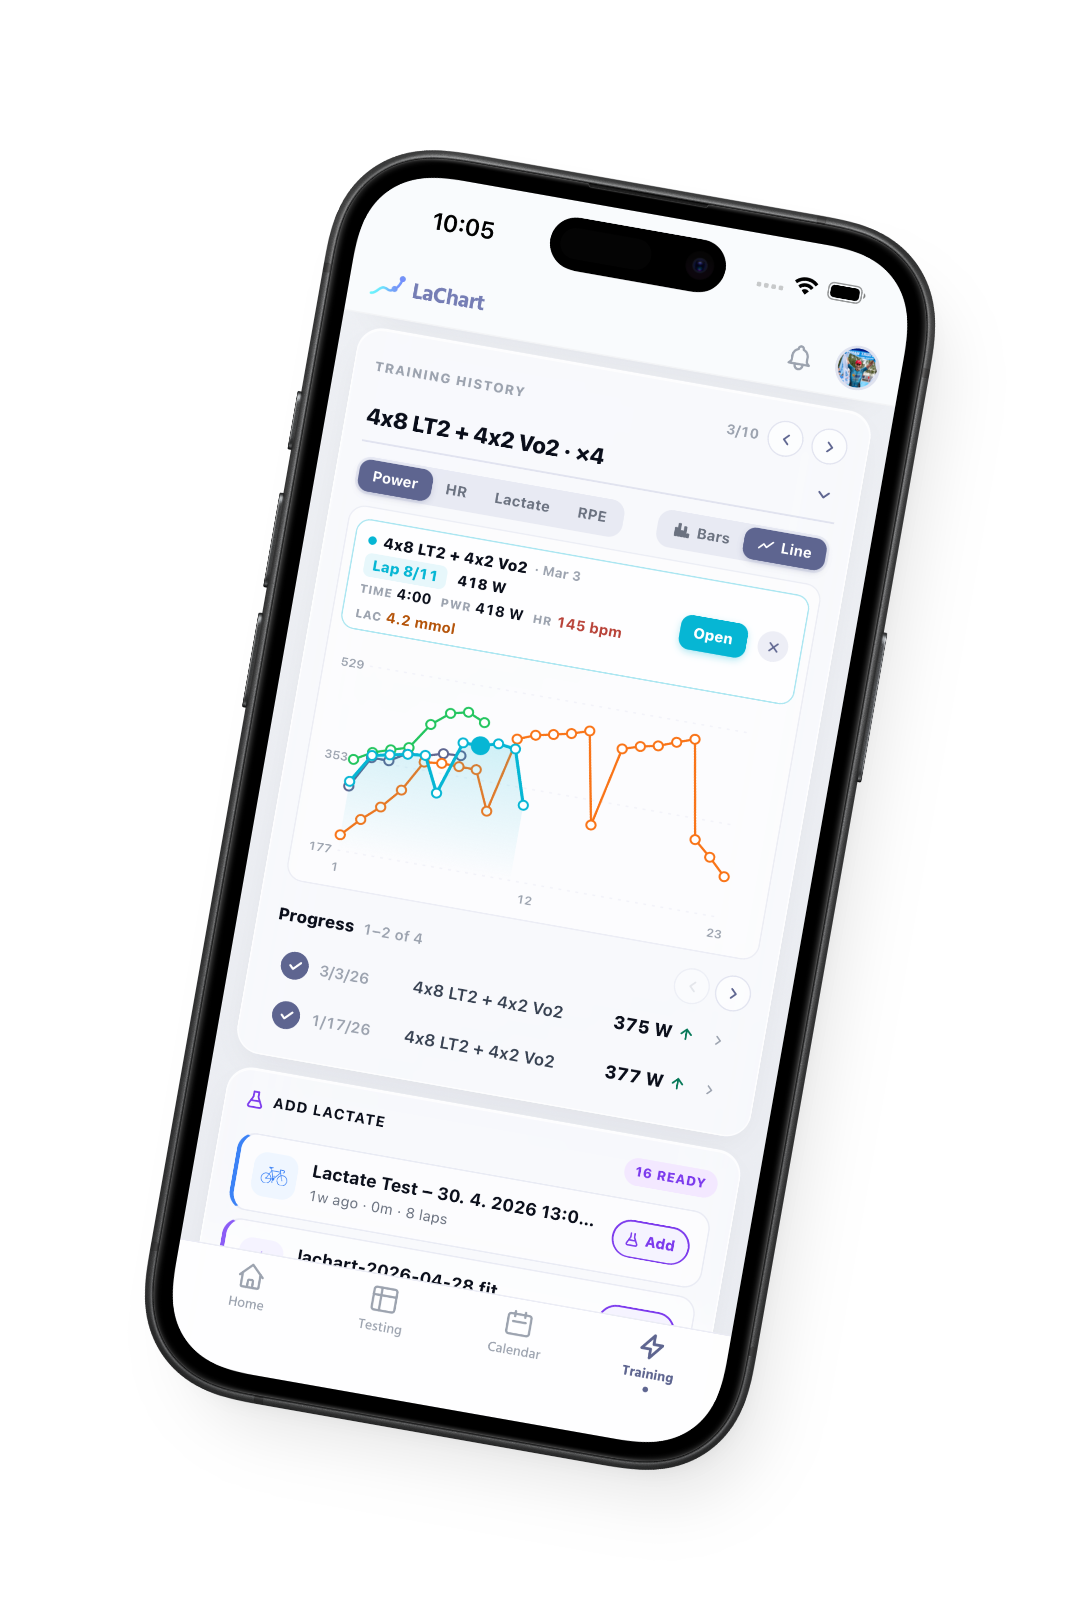
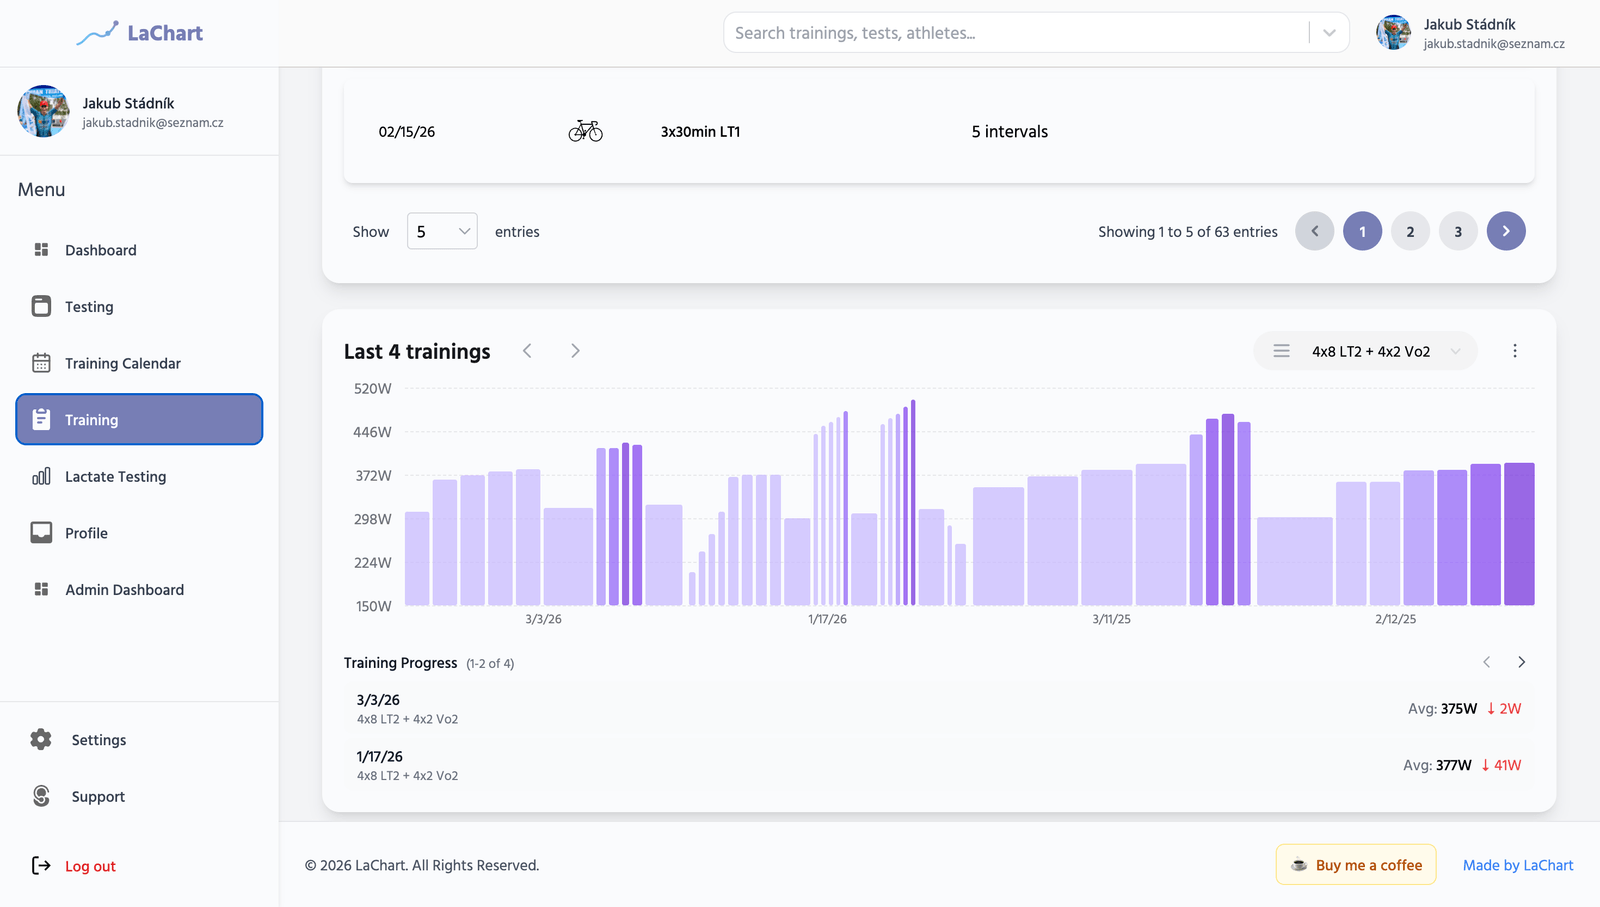
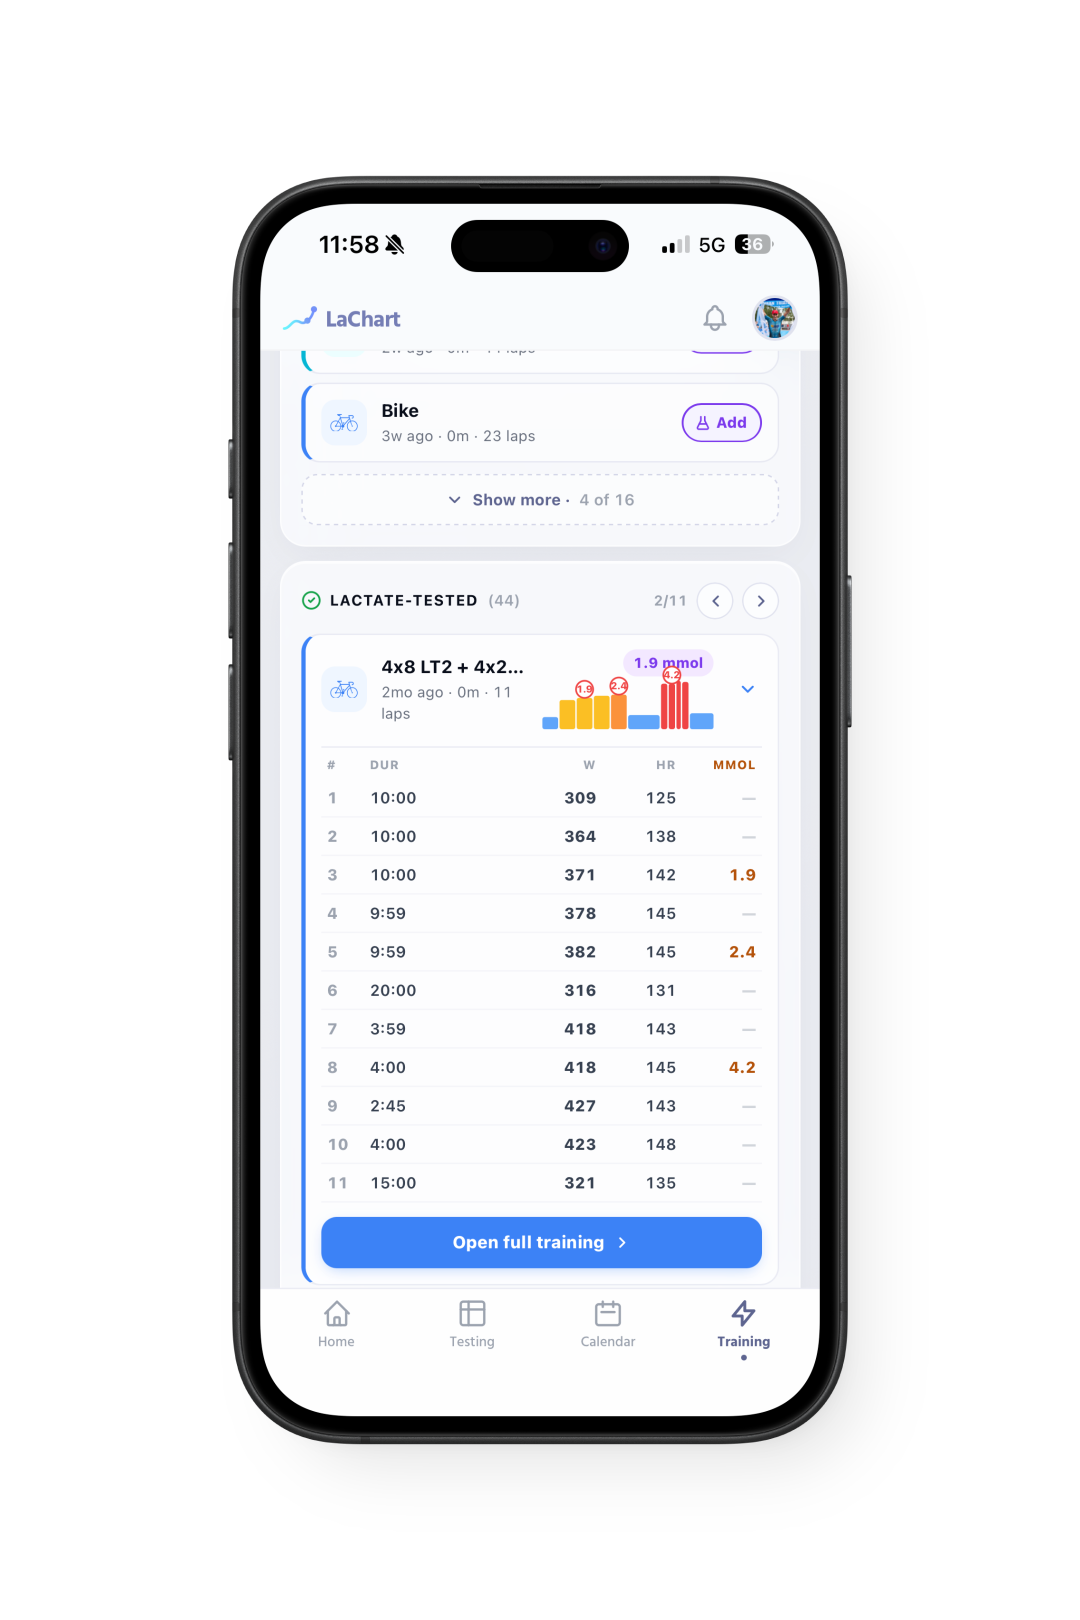
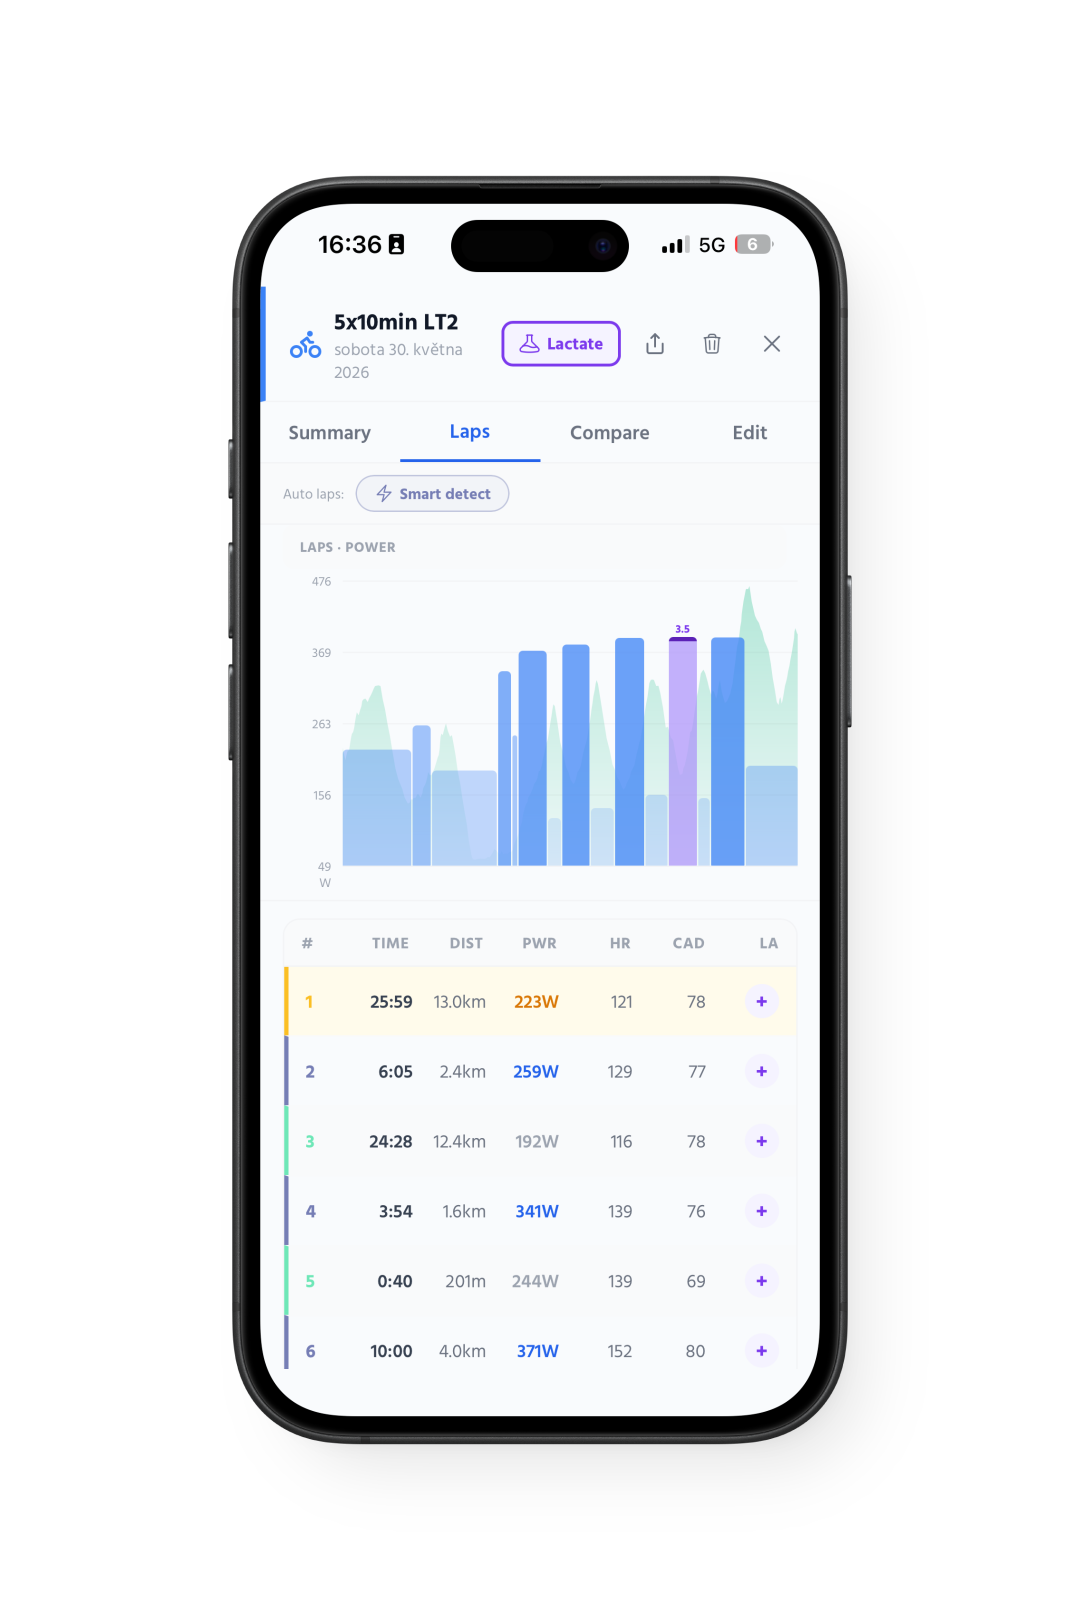
Open any training and tag any interval with a blood sample. Empty dots are tap-to-log. Every sample feeds back into your curve and your zones.
Power, HR, cadence and pace per interval
Auto-detected laps from FIT and Strava
"Ready for lactate" filter surfaces untagged sessions
lachart.net — Training
Calendar
Your whole training week, month, season
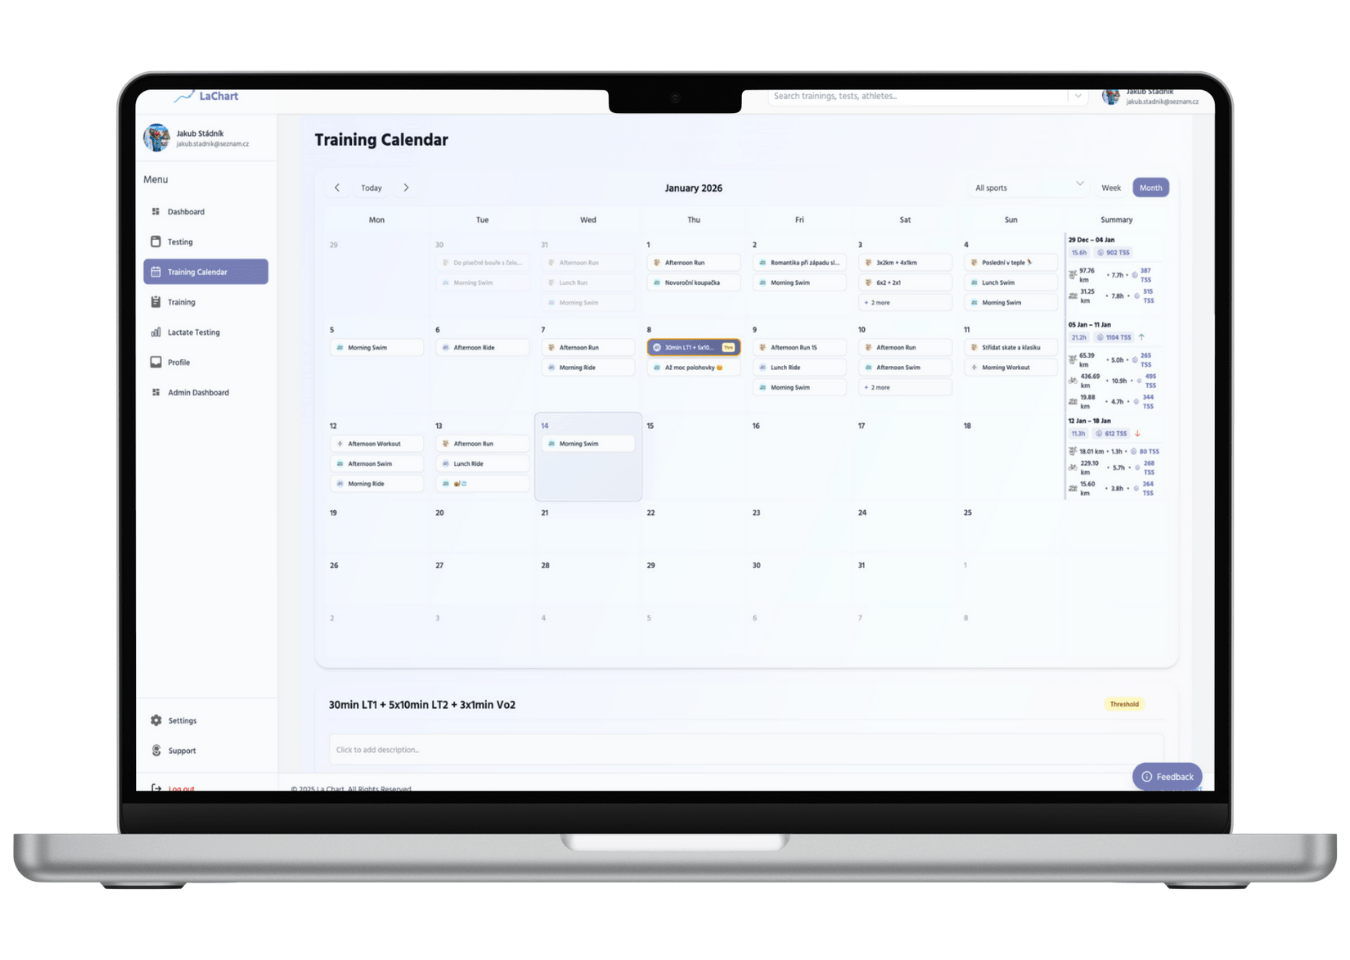
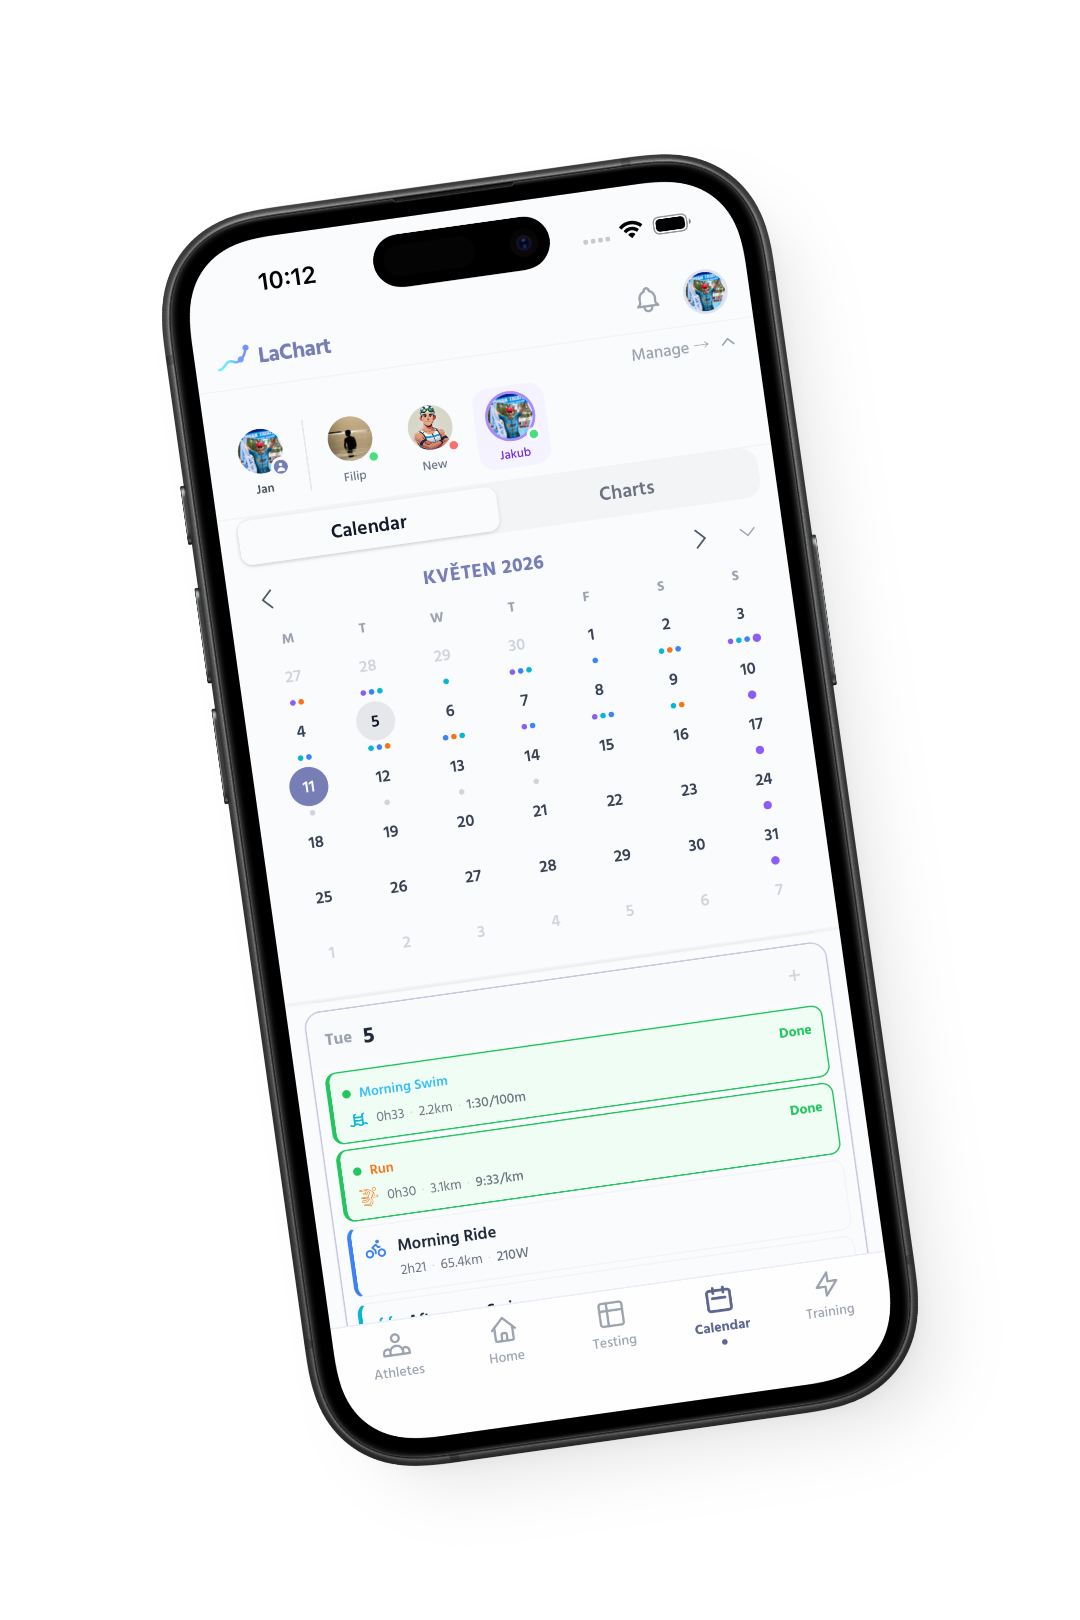
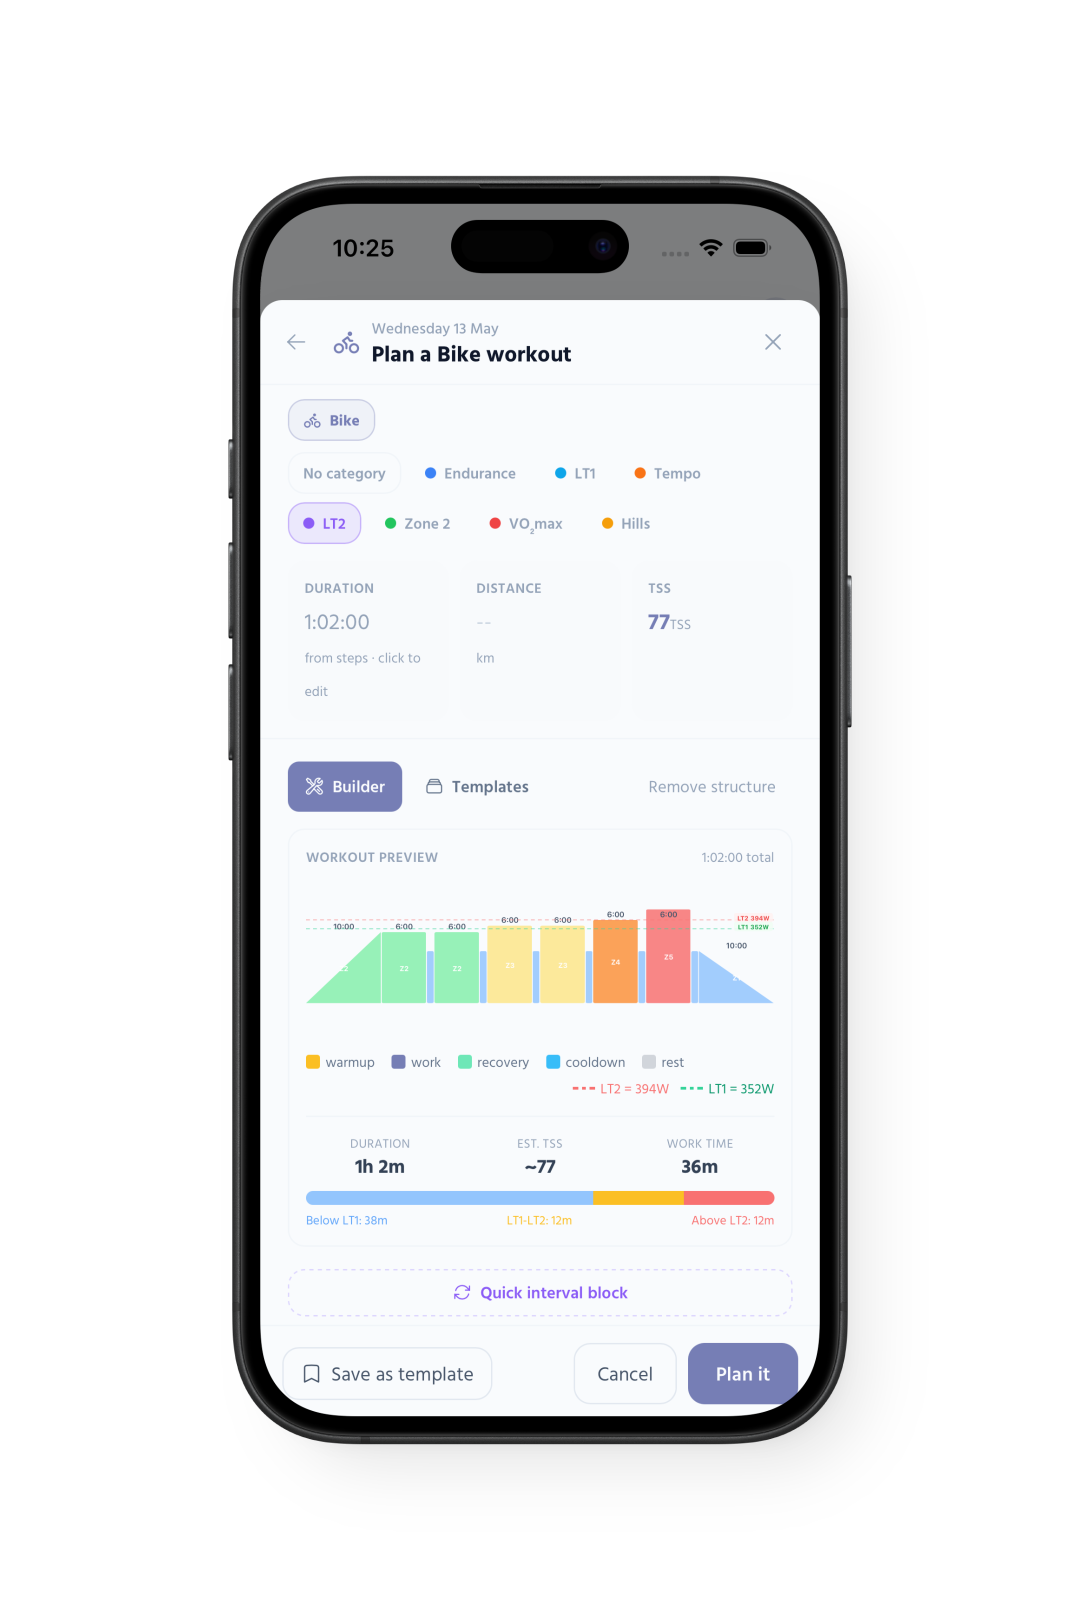
An interactive calendar of every workout — completed, planned, with lactate, without. Click any day to see the session, intervals and zones.
Color-coded by sport and intensity
Strava and FIT activities appear automatically
Daily TSS bars track weekly load
lachart.net — Calendar
PDF reports
Professional test reports in seconds
Branded PDF with your lactate curve, HR overlay, color-coded zones, threshold table, previous-test comparison and training recommendations.
Curve + HR overlay on a single page
All thresholds (LTP1, LTP2, OBLA, IAT)
Stage-by-stage results table
Personalised training recommendations
test_lisa_2026-04-12.pdf
The science
LT1, LT2, OBLA & D-max — four lactate threshold methods
LaChart calculates lactate thresholds using OBLA, D-max, IAT and Log-log — the four most-cited methods in exercise science. Use them side by side or stick to your federation's standard.
Most used
OBLA
Onset of Blood Lactate Accumulation
Fixed at 4.0 mmol/L. The power output at which your blood lactate first reaches 4 mmol/L on a graded test.
LT₂ = pace @ 4.0 mmol/L
Dmax
Geometric inflection
The point where your curve bends most sharply from the line connecting baseline lactate to peak. Independent of fixed values.
LT₂ = max perpendicular distance
IAT
Individual Anaerobic Threshold
Takes your individual baseline lactate and adds 1.5 mmol/L. More accurate for highly trained athletes with low resting values.
LT₂ = baseline + 1.5 mmol/L
Log-log
First-rise inflection
Plots log(lactate) vs log(intensity). The first clear break in slope marks LT1 — the aerobic threshold.
LT₁ = first slope change
Learn
Blood lactate testing — the science explained
Long-form guides on blood lactate testing protocols, threshold detection methods (LT1, LT2, OBLA, D-max), and what your lactate curve actually means for training zones.
Connect Strava, upload Garmin/Wahoo FIT files, or enter data manually. Every workout and lactate value flows into one platform.
Strava
Auto-sync activities, full interval detection, power graphs and HR zones.
FIT files
Garmin, Wahoo, Polar, Suunto — every device supported.
Manual entry
Log any workout in 30 seconds — even ones without a head unit.
Used by
Lactate testing used by cyclists, runners & triathletes
★★★★★
"The first lactate app that doesn't feel like Excel. I do my own home tests every 4 weeks and the curve drops into my training within seconds."
Tomáš H.· Cat 1 cyclist · Praha
★★★★★
"I coach 14 triathletes. The athlete switcher and the "ready for lactate" filter saved me two hours a week. Status dots are pure gold."
Markus B.· Triathlon coach · Innsbruck
★★★★★
"I switched from spreadsheets after my first test. Seeing LT1 and LT2 land on the same chart — with the previous test underneath — is a game changer for steady-state work."
Eva K.· Sub-elite marathoner · Brno
What's new
Latest shipping notes
The most-recent additions to LaChart. Quarterly releases, plus one-off updates whenever something useful is ready.
Jun 2026· Mobile
iOS app — now on the App Store
LaChart for iPhone is live. Native dashboard widget, today's training, Apple Health sync, push notifications and on-device lactate recording — free download.
Free on the App Store. Today's training, Form / Fitness / Fatigue home-screen widget, Apple Health sync, push notifications, and on-device lactate recording. Android is next.
Drop your step-test values into the free Lactate Calculator. You'll see your curve, LT1, LT2, OBLA, IAT, D-max and matching training zones in real time — no account required.
Eight threshold methods calculated in parallel
Power, pace and heart-rate zones tailored to your sport
Test lactate and see your curve for free. Unlock unlimited tests, full history and analytics on Athlete — or run your whole roster on Coach with 2 weeks free. Cancel anytime.
🎁 Coaches: 2 weeks free — no charge today
Run your full roster of athletes on the Coach plan free for 2 weeks. Cancel anytime before it ends and you pay nothing.
Everything you need to know about blood lactate testing, LT1/LT2 thresholds, and LaChart. Can't find it? Email us.
What is lactate threshold and why does it matter?+
Lactate threshold is the intensity at which lactate accumulates in your blood faster than it's cleared. It's the single most useful number for endurance training because it sets your tempo / threshold / steady-state ceiling — and it shifts as you train. LaChart finds it from a graded test in 60 seconds.
How accurate is the calculator vs a lab?+
LaChart uses the same OBLA / Dmax / IAT / Log-log methods sport-science labs use. Accuracy depends on your sampling protocol — same protocol in and you get lab-comparable thresholds.
Do I need to register to use the calculator?+
No. The free calculator runs without an account. A free account adds saving, history, comparison and PDF export.
Which sports does LaChart cover?+
Cycling, running, swimming and triathlon. Power-based for bike, pace-based for run / swim, HR overlay on every chart.
Can I generate a PDF report from my lactate test?+
Yes. After a test you can download a branded PDF with the lactate curve, HR overlay, all thresholds (LTP1, LTP2, OBLA, IAT), the five training zones, stage-by-stage results, a comparison with your previous test and personalised training recommendations.
Is my data exportable?+
Yes. Every account can export training history (CSV) and individual tests (PDF). We don't lock your data in.
Run your first blood lactate test — it's free
No credit card. No downloads. Enter your lactate test values and see your LT1 & LT2 thresholds in seconds.